
Bitcoin Smart Money: Glassnode Reveals How Large Traders Timed The Pullback
Data from Glassnode has revealed how the large Bitcoin traders showed expert timing in the derivatives market during the market reversal.
Bitcoin Large Traders Have Shifted To A Net Short Bias
In a new post on X, on-chain analytics firm Glassnode has talked about how the large Bitcoin traders behaved during the latest pullback in the cryptocurrency’s price.
Below is the chart shared by Glassnode that shows the trend in the BTC Long/Short Bias, a metric tracking the difference between long and short positions opened by the large investors on derivatives exchanges, over the past couple of months.
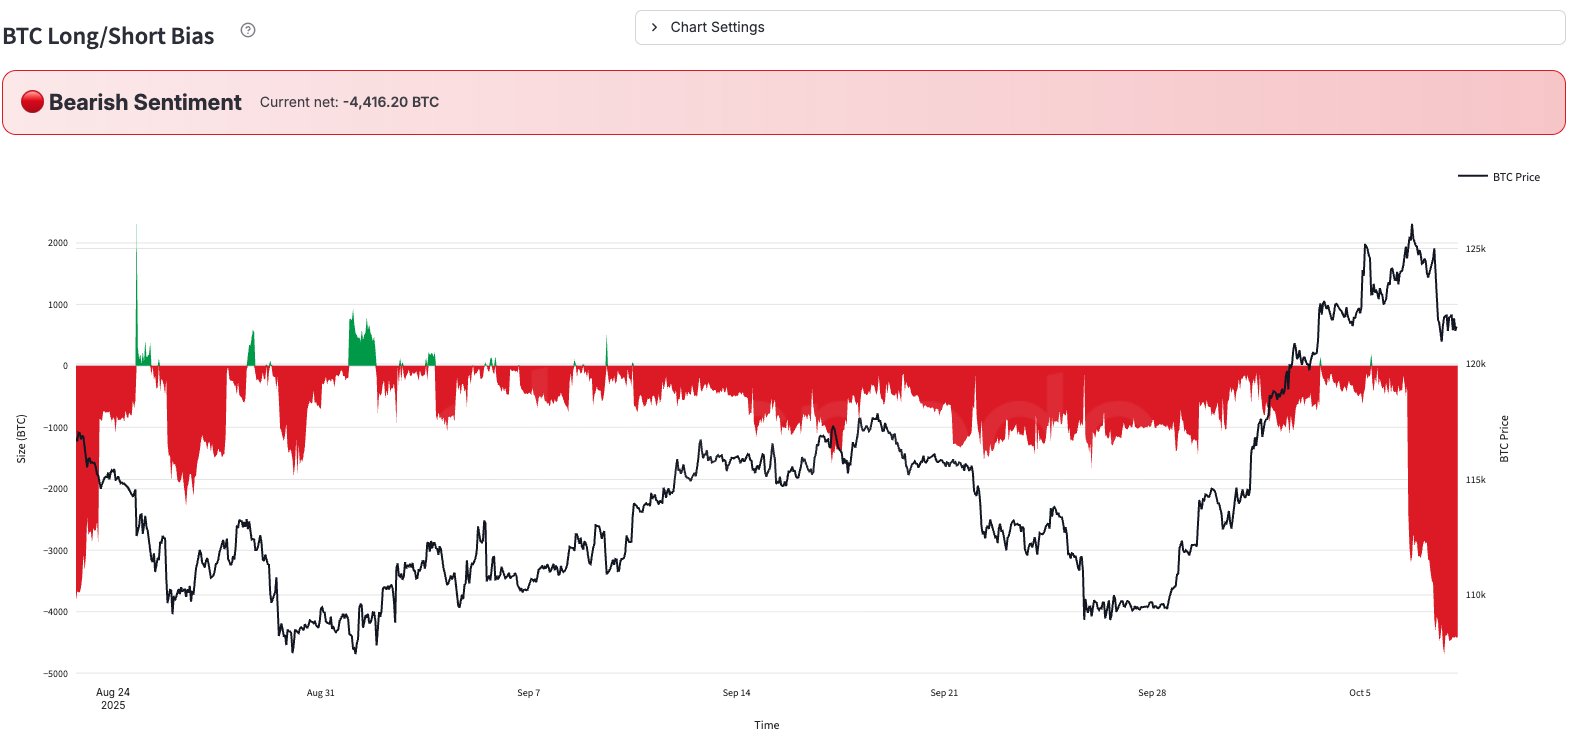
From the graph, it’s visible that the Long/Short Bias has mostly been at a slight negative level for Bitcoin during the last few weeks, indicating that the large traders have just leaned toward short positioning. When BTC set its initial all-time high (ATH) above $125,000 on Saturday, however, the indicator assumed a small positive value, implying there was a slight bias toward a bullish sentiment among derivatives users.
Interestingly, this same behavior wasn’t seen during the second ATH break above $126,000 on Monday. In fact, the whales behaved in the completely opposite manner: the Long/Short Bias saw a plunge deep into the negative territory. “The shift to a net short bias suggests profit-taking on longs alongside new short positioning,” notes the analytics firm. Thus, it would seem that the large traders were anticipating a price pullback after the price top, so they started moving in advance.
The Long/Short Bias only saw a further decline when Tuesday’s fast crash below $121,000 took place. Now, the metric is sitting at a value of -4,416.20 BTC, which means bearish bets outweigh bullish ones by more than 4,400 tokens.
It now remains to be seen how sentiment among the Bitcoin whales will develop in the coming days. Another shift from smart money could potentially foreshadow another shift for the asset’s price as well, given the latest pattern.
In some other news, the recent Bitcoin price surge has meant that Percent Supply in Profit has broken into an extreme territory, as Glassnode has pointed out in another X post.
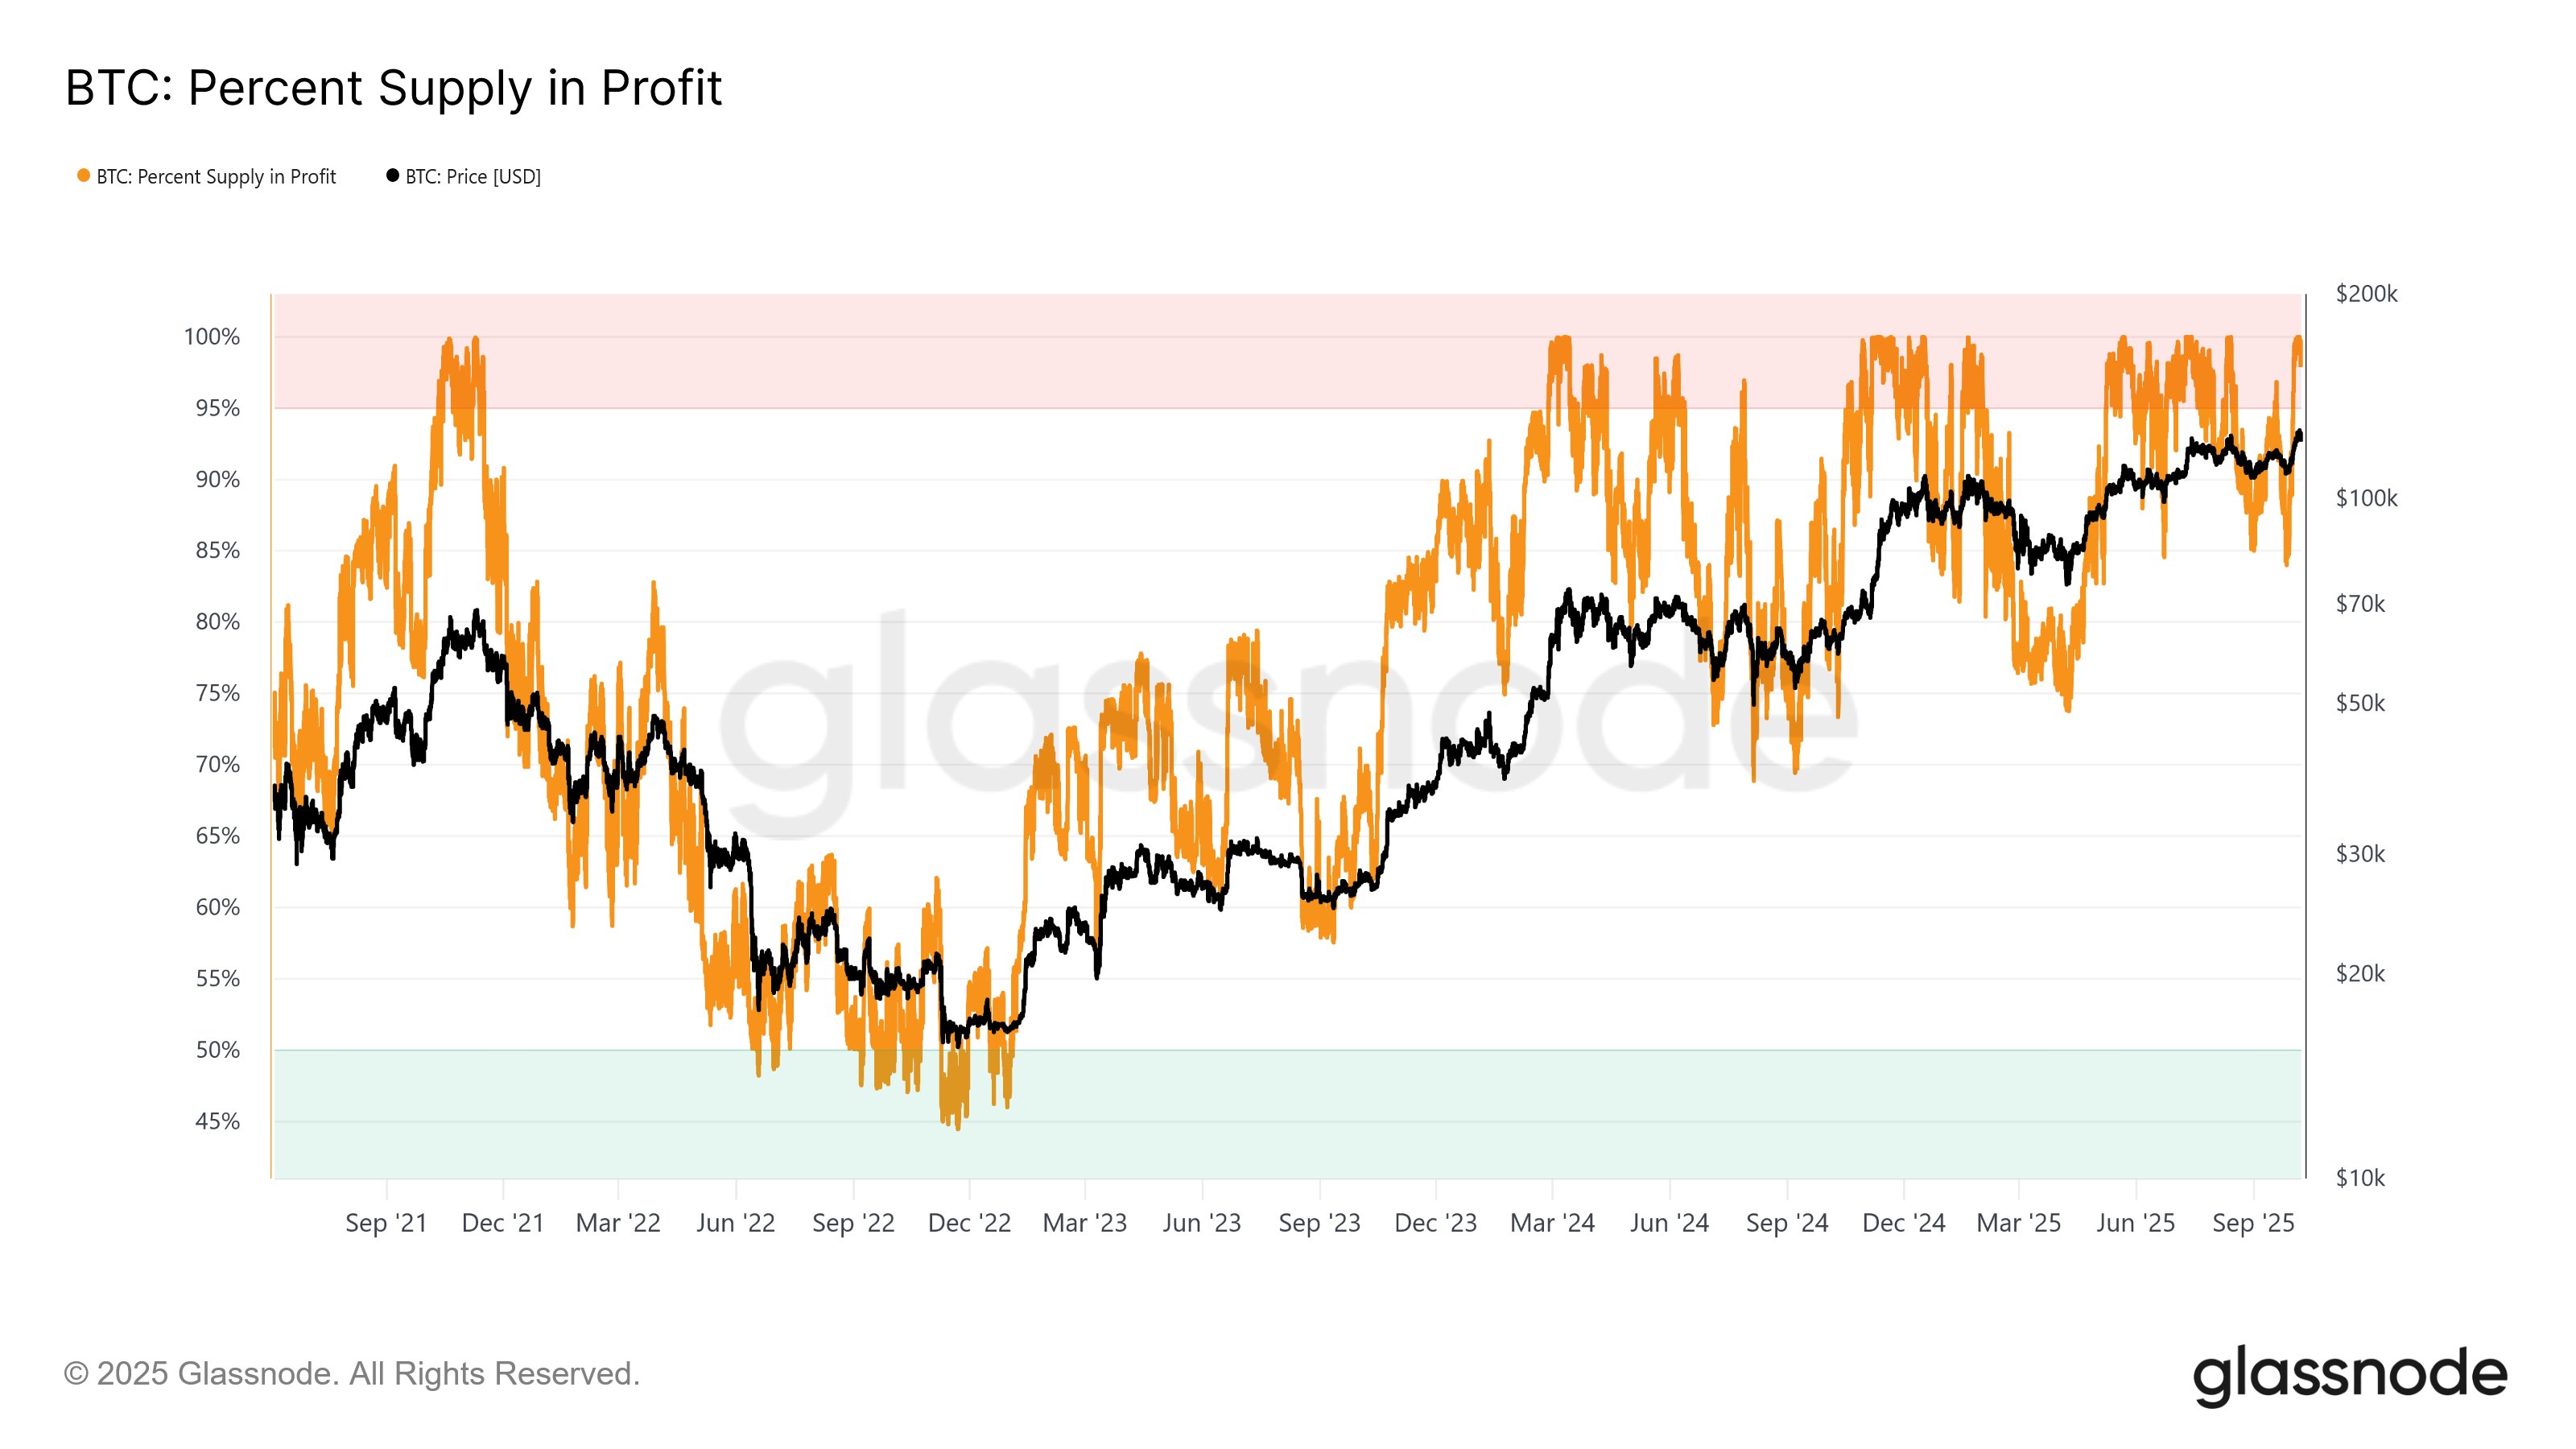
As displayed in the above chart, the Bitcoin Percent Supply in Profit broke above 95% when it crossed the $117,000 level during the rally. Naturally, the metric later went on to reach 100% as BTC set a new ATH, since everyone is in the green whenever the cryptocurrency explores new price levels.
Historically, the metric being above 95% has often indicated overheated conditions for BTC. As the analytics firm explains, such a high value is “a hallmark of Euphoria phases, where widespread profitability often fuels accelerated profit-taking and rising market risk.”
BTC Price
Bitcoin has shown some recovery during the past day as its price has returned to the $123,000 mark.
Recommended Articles


