




Bitcoin Moving With Stocks, But Ethereum’s Correlation Is Fading


Bitcoin has been showing notable correlation to the stock equities recently, but data shows Ethereum is charting a more independent path.
Bitcoin & Ethereum Showing Different Degrees Of Correlation To Other Assets
In a post on X, the institutional DeFi solutions provider Sentora (previously IntoTheBlock) has talked about how the latest Correlation Matrix has looked between the two largest cryptocurrencies, Bitcoin and Ethereum, and traditional markets. The “Correlation Matrix” here refers to an indicator that tells us how closely tied together the prices of two given assets currently are.
When the value of this metric is positive, it means the assets are reacting to moves in each other by moving in the same direction to some degree. The closer the metric is to 1, the stronger the relationship.
On the other hand, the indicator being under the zero mark implies there is a negative correlation between the two prices. That is, they are moving in opposite directions. For this side of the scale, the extreme point is -1.
Naturally, the Correlation Matrix showing a value exactly equal to zero suggests there is no correlation whatsoever between the assets. In statistics, the two variables are said to be ‘independent’ in this case.
Now, here is the table shared by Sentora that shows how the Correlation Matrix of Bitcoin and Ethereum stands with respect to some traditional markets:
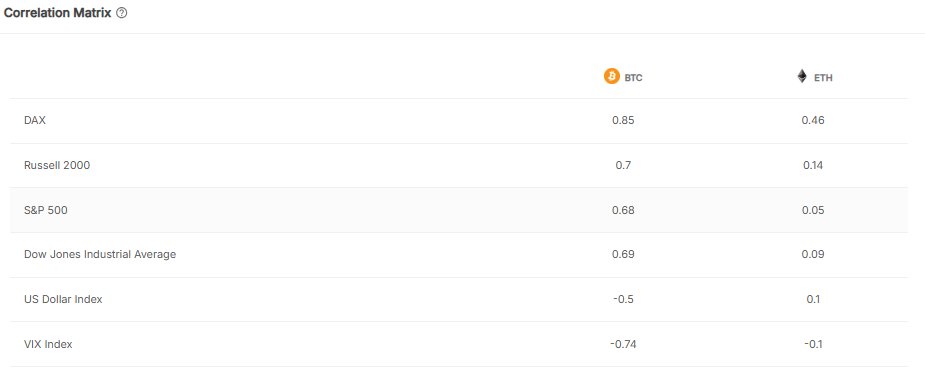
As is visible above, the index that Bitcoin and Ethereum have the strongest positive correlation to is DAX. That said, the Correlation Matrix stands at 0.46 for ETH, meaning that while some correlation does exist, it’s not too intense. This isn’t the case for Bitcoin, which has the indicator sitting at 0.85, indicating its price is pretty in tandem with DAX.
Likewise, BTC has a notable correlation to other stock market indices, with a metric value of 0.7, 0.68, and 0.69 for the Russel 2000, S&P 500, and Dow Jones Industrial Average, respectively. In contrast, Ethereum is almost fully independent from these indices, with the indicator standing quite close to zero for each of them.
For US Dollar Index and VIX Index, the last two markets listed in the table, the Correlation Matrix is inside the negative zone for Bitcoin. This means that the digital asset has actively been moving against these indices.
“Right now, the spotlight is on the U.S. Dollar Index (DXY): if geopolitical and macro tensions drag the dollar lower, that backdrop could create room for another leg higher in BTC,” notes the analytics firm.
Just like with the stocks, Ethereum is displaying little correlation to DXY and VIX, further reinforcing that the cryptocurrency has been following a trajectory of its own recently.
BTC Price
Bitcoin is mounting another bullish push as its price surges to $109,400, but it remains to be seen whether its fate will be any different from the weekend move.
Disclaimer: The content presented above, whether from a third party or not, is considered as general advice only. CFD trading involves significant risk of loss. Past performance does not guarantee future results. This article serves informational purposes only and does not constitute financial advice. Consider your risk tolerance before trading.


