


Top Crypto Gainers: Zcash, Mantle outshine market turbulence, Pudgy Penguins ranks third
- Zcash rally eyes further gains amid an impending Golden Cross on the weekly chart.
- Mantle extends into price discovery mode, approaching the $3.00 milestone.
- Pudgy Penguins consolidates near the 50-day EMA within a falling channel pattern.
Zcash (ZEC) and Mantle (MNT) record double-digit gains in the last 24 hours, outperforming the broader cryptocurrency market. Pudgy Penguins (PENGU) ranks third among the best-performing cryptocurrencies over the same period, with a nearly 7% rise on Wednesday.
Technically, ZEC and MNT are in a strong uptrend, hinting at further gains, while PENGU stalls within a falling channel pattern.
Zcash rally approaches a key resistance
Zcash recorded a nearly 40% rise on Wednesday, reaching a high of $185.57, which marks the highest price since April 2, 2022. At the time of writing, the ZEC rally takes a breather with an intraday pullback of over 1% on Thursday.
The recovery triggers a sharp rise in the 50-week Exponential Moving Average (EMA), setting it up to cross above the 200-week EMA, which will signal a Golden Cross pattern. Typically, such a crossover indicates that the short-term rally holds stronger momentum compared to the prevailing trend.
The technical indicators on the weekly chart corroborate the rise in bullish momentum, as the Relative Strength Index (RSI) is deep in the overbought zone, reading 88. However, it also bears the risk of a potential reversal, which is a common occurrence at high RSI values.
Additionally, the Moving Average Convergence Divergence (MACD) and its signal line display a parabolic rise, accompanied by a significant increase in green histogram bars, which reflects the surge in buying pressure.
A decisive push above the 78.6% Fibonacci retracement level at $189.17, drawn from the May 2021 high at $372.00 to the July 2024 low at $15.78, could drive the rally above the $200 psychological mark. The key resistance for the privacy coin lies at the $372.00 peak from May 2021.
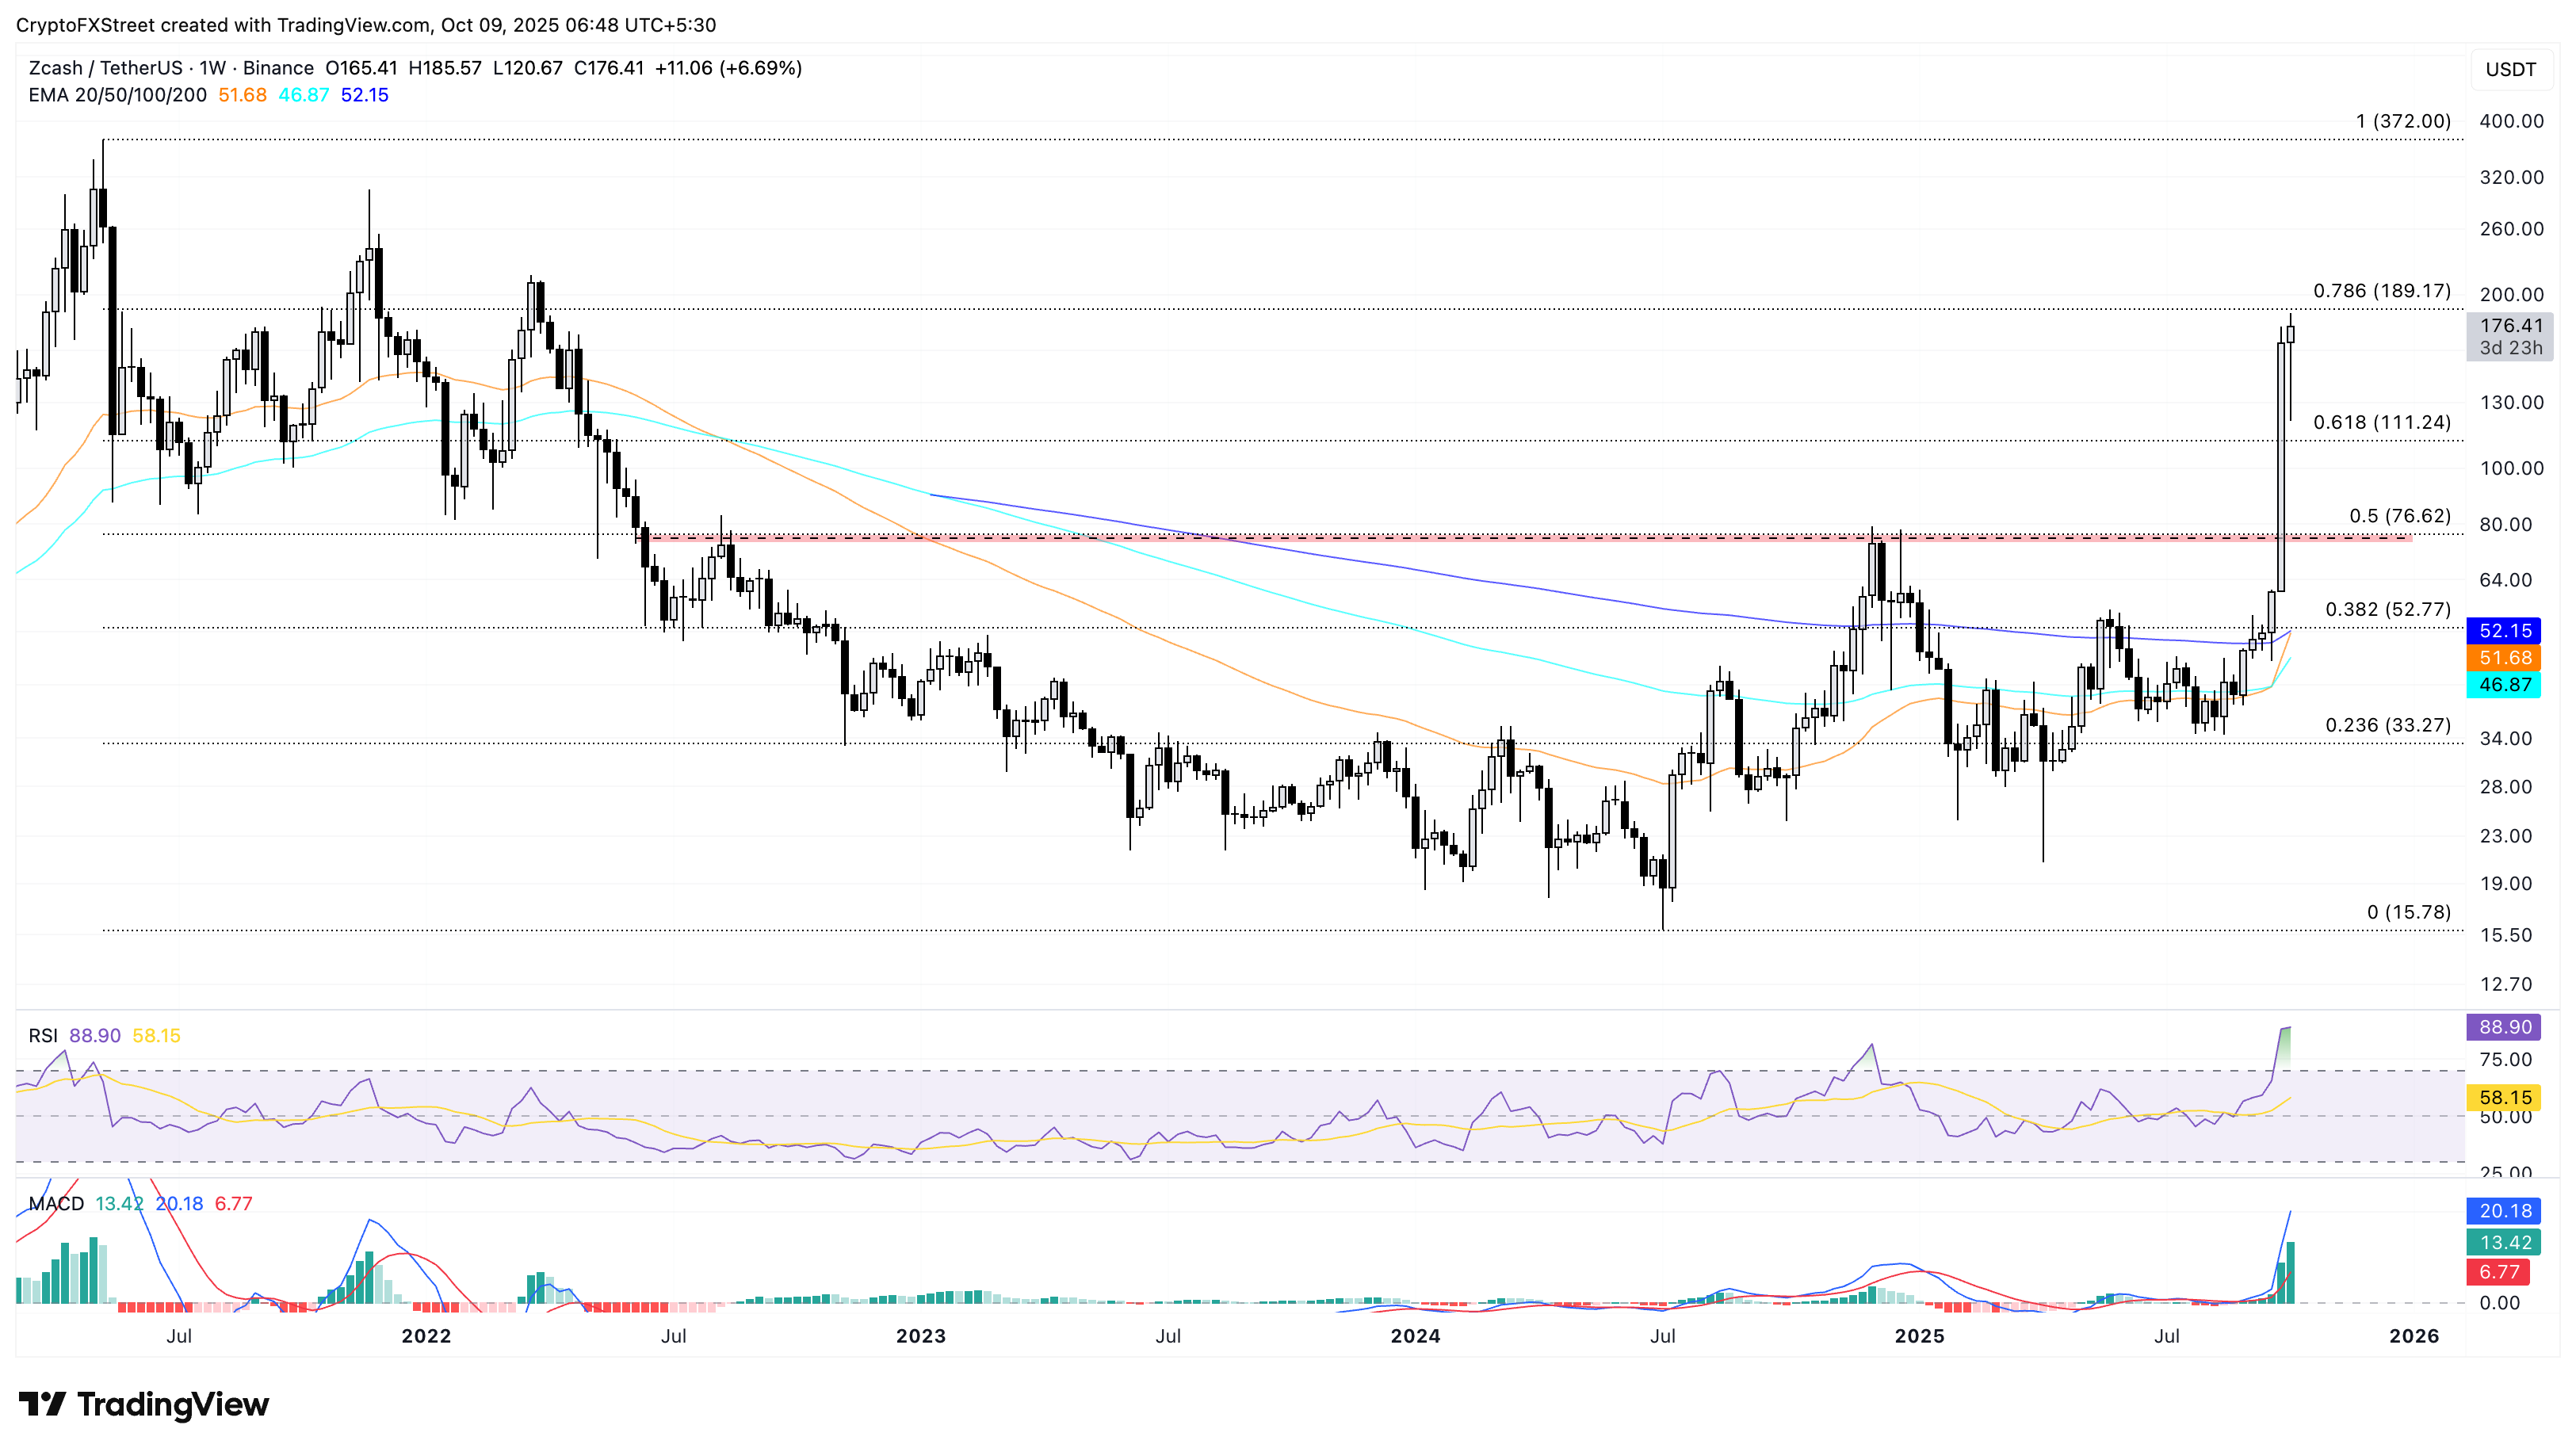
ZEC/USDT weekly price chart.
Looking down, if ZEC flips from $189.17, it could test the 61.8% Fibonacci retracement level at $111.24.
Mantle eyes further gains as bullish momentum holds
Mantle edges higher by 5% at press time on Thursday, after the 17% jump on the previous day. The MNT rally approaches the R3 Pivot Point level at $2.99 as the next key resistance.
A clean push above $2.99 could extend the uptrend to the R4 Pivot Point level at $3.51.
The RSI on the daily chart at 75 holds a sideways track in the overbought zone, suggesting that buying pressure remains steady. Additionally, the MACD and its signal line keep a steady uptrend, flashing a bullish trend in motion.
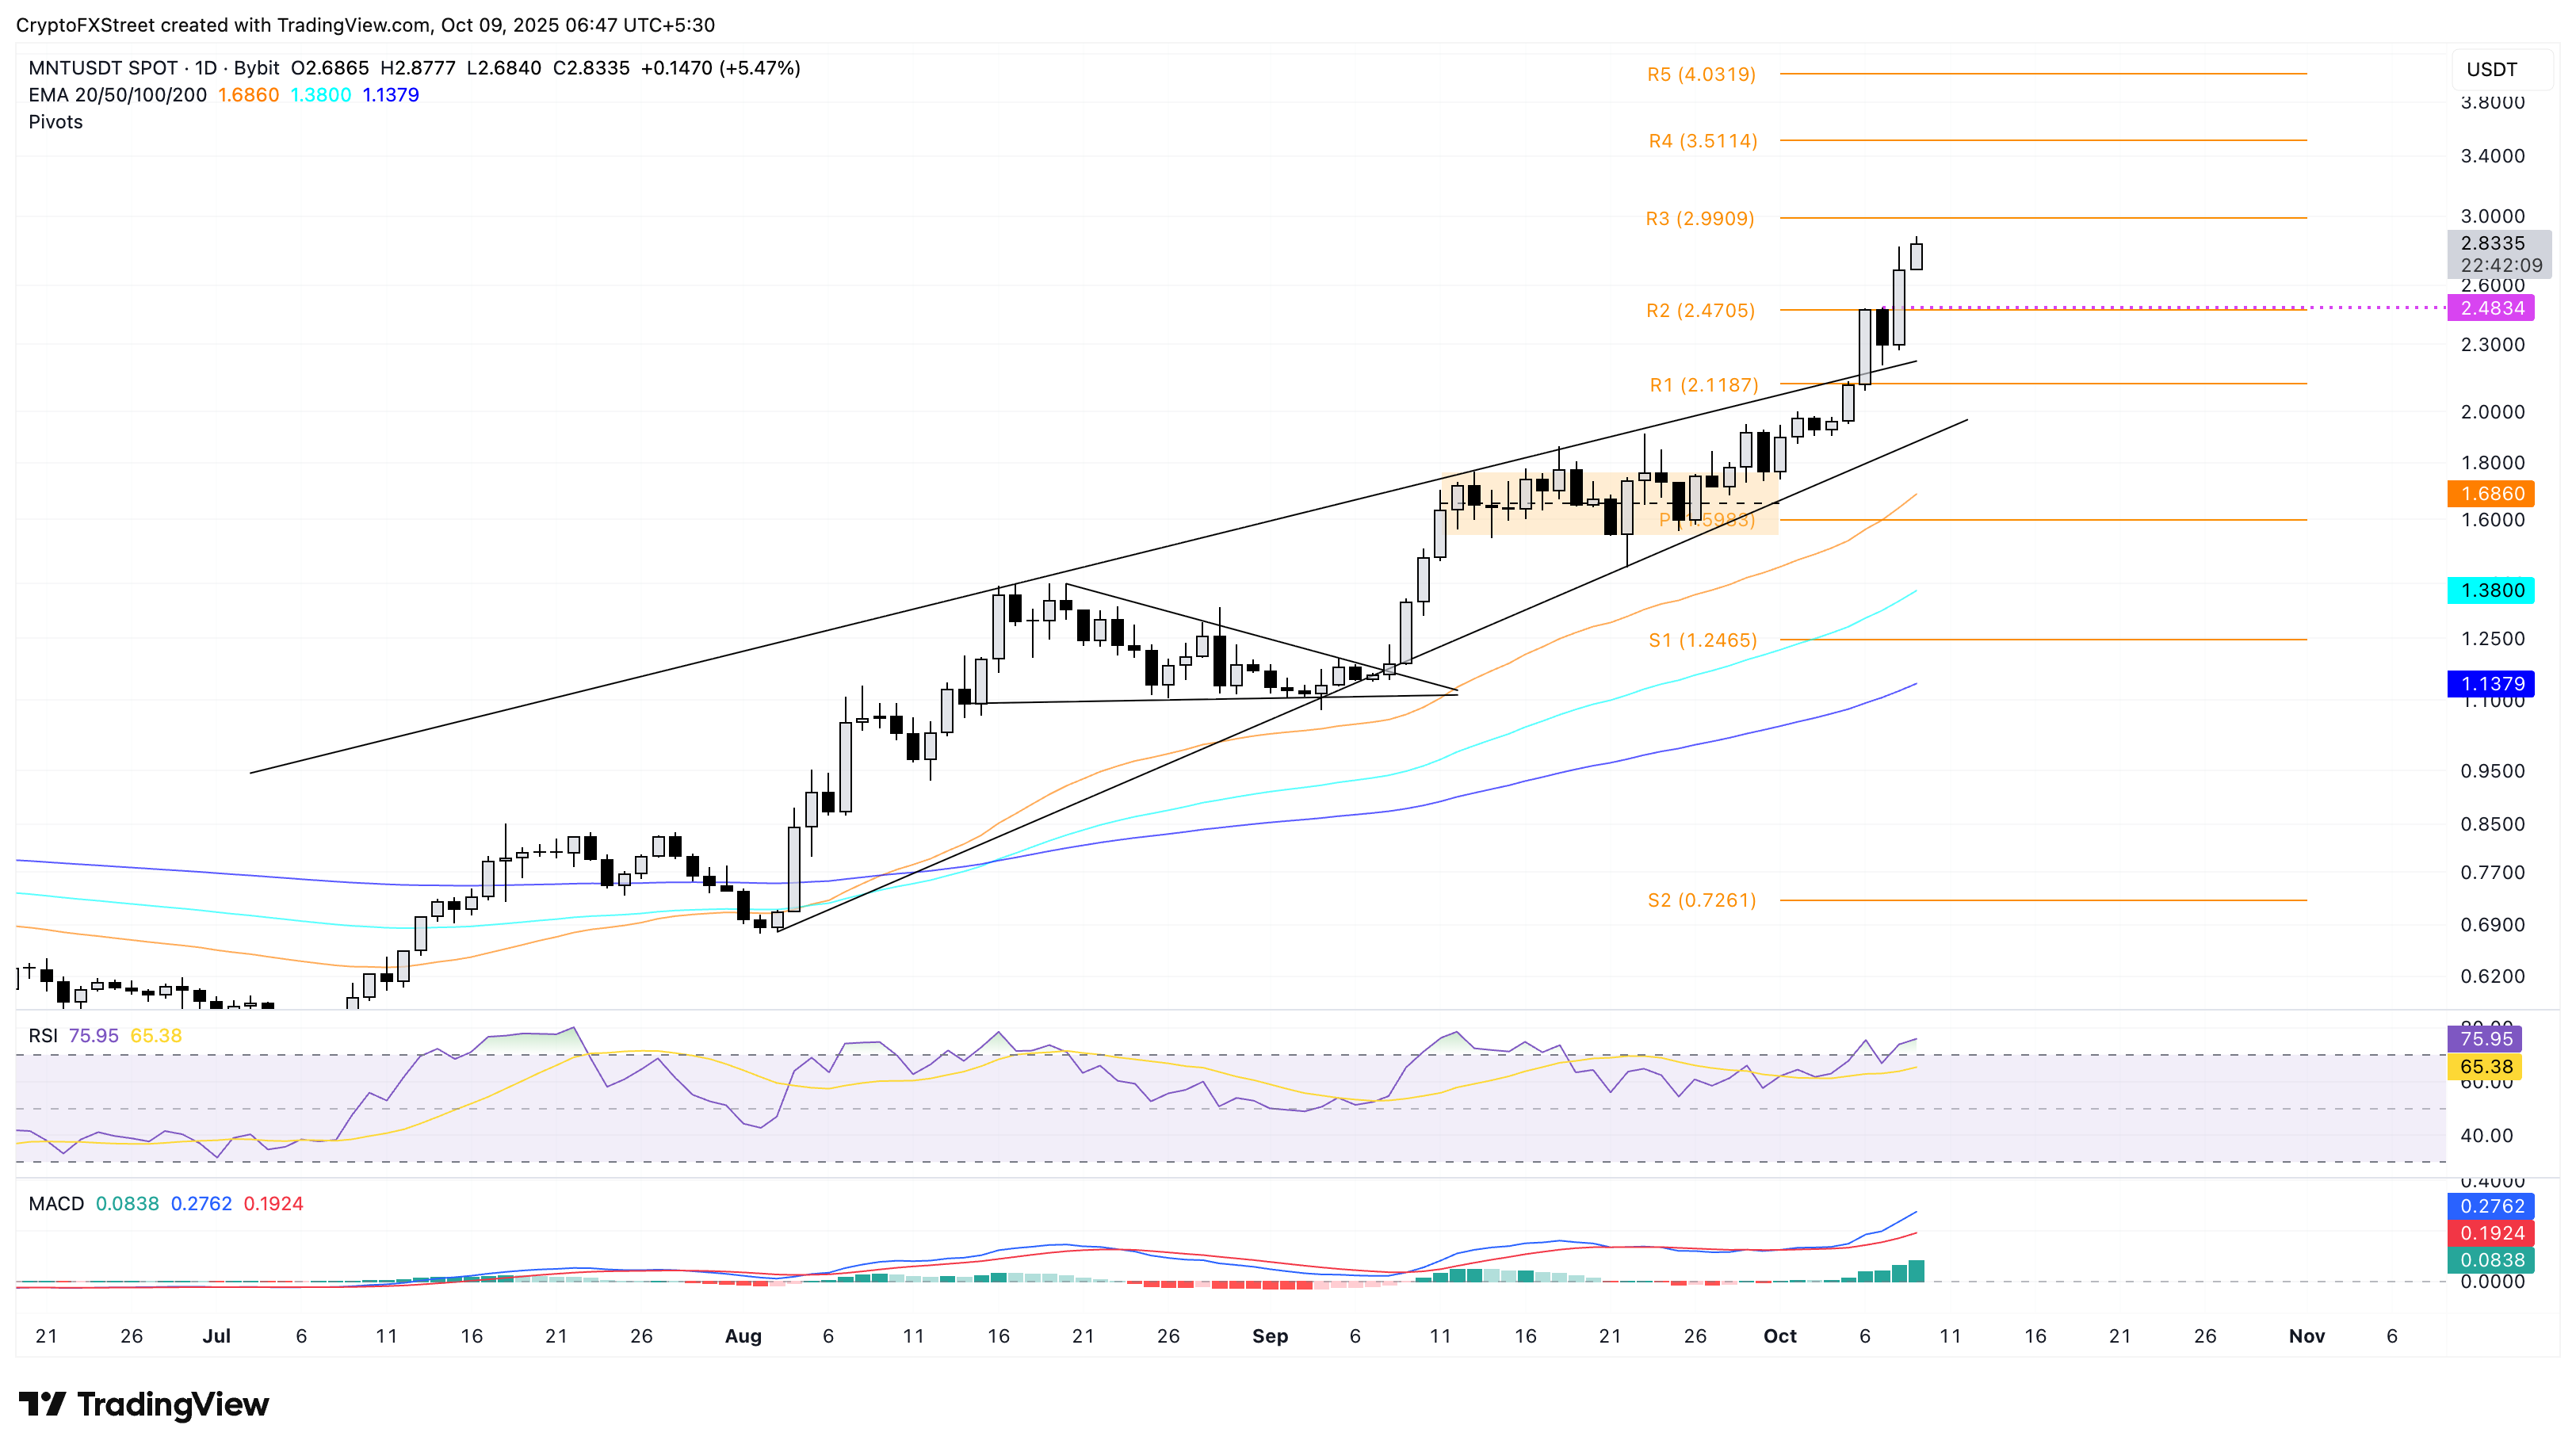
MNT/USDT daily price chart.
If MNT reverses from or before the $2.99 level, the key areas of support for MNT are the R2 and R1 resistance-turned-support Pivot Point levels at $2.47 and $2.11, respectively.
Pudgy Penguins consolidates at the 50-day EMA
Pudgy Penguins maintain a steady movement around the 50-day EMA, within a falling channel pattern on the daily chart. At the time of writing, PENGU is down by 1% on Thursday, following the nearly 7% rise on Wednesday.
The falling channel resistance trendline aligns with the R1 Pivot Point level at $0.036322, while the 200-day EMA at $0.025311 approaches the support trendline. A decisive close beyond this boundary would confirm the breakout of the channel pattern.
An upside breakout could stretch the PENGU rally to the R2 Pivot Point at $0.044735.
The momentum indicators on the daily chart remain neutral, as the RSI at 52 hovers near the midpoint level. Meanwhile, the MACD and its signal line move almost flat in a positive alignment, aiming for the zero line.
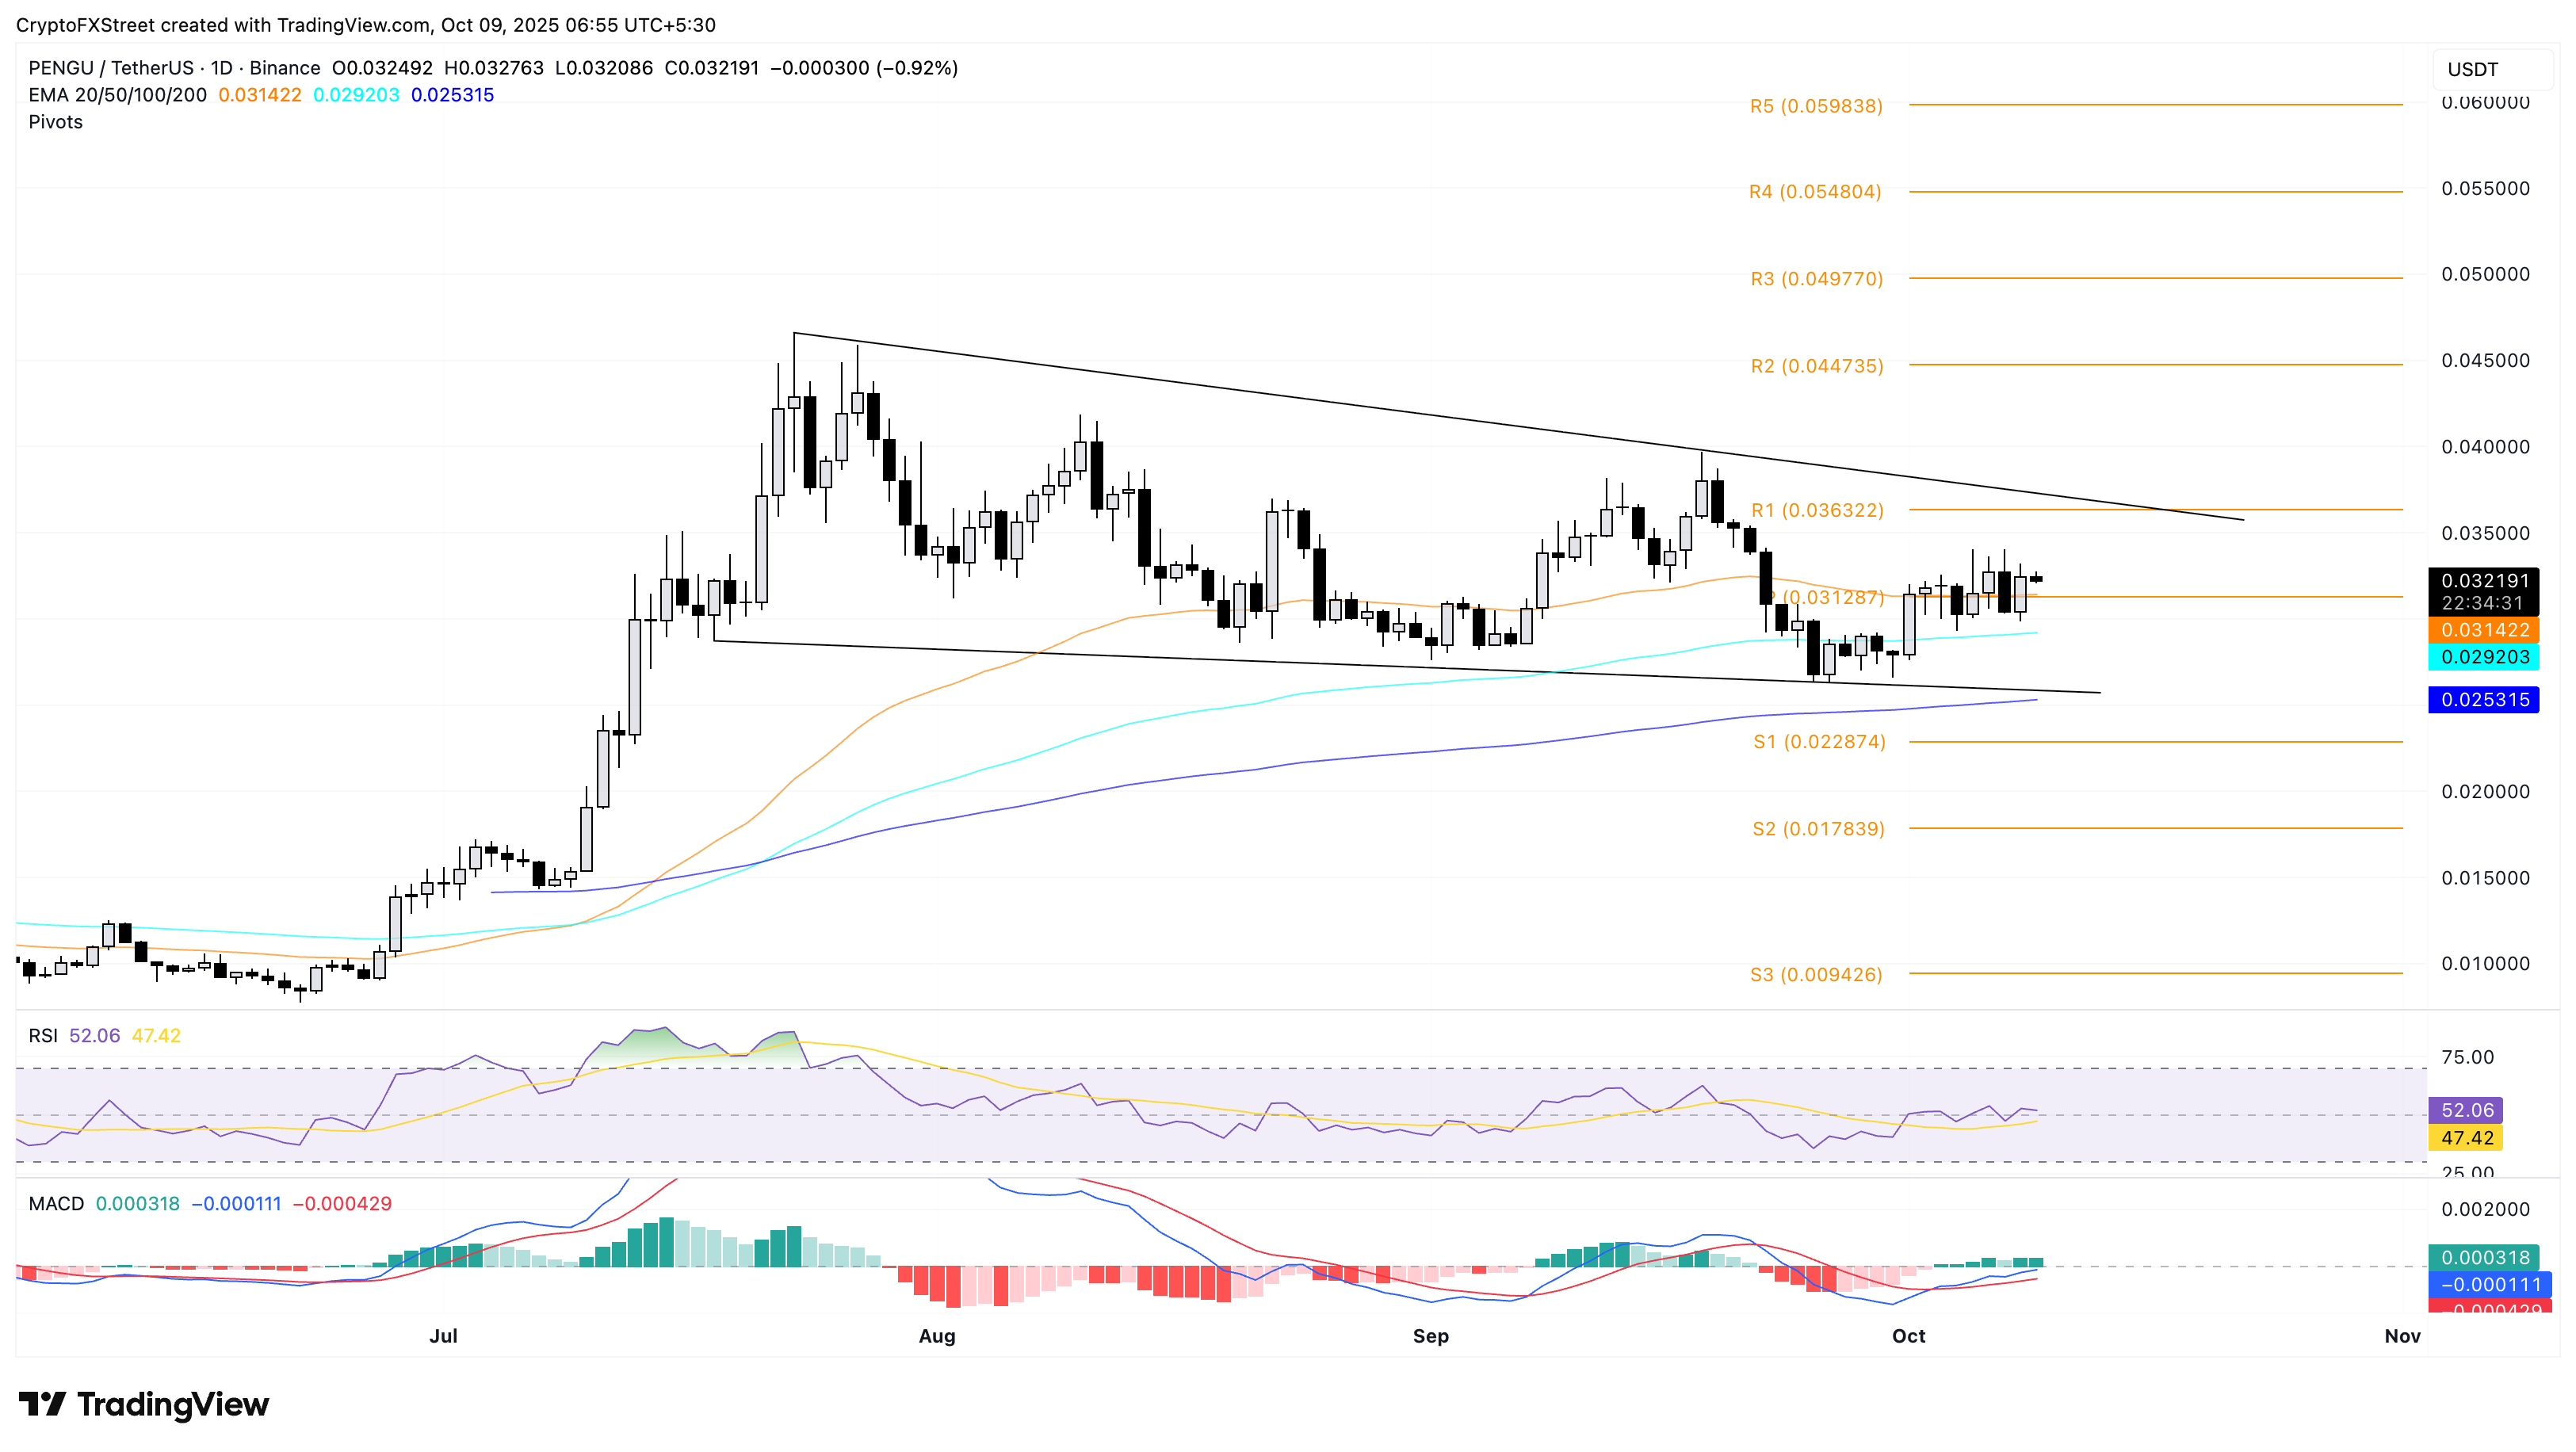
PENGU/USDT daily price chart.
If PENGU slips below the 200-day EMA, it could test the S1 Pivot Point level at $0.022874.
Recommended Articles


