




Gold price forecast: XAU/USD toys with $5,000 level on Tuesday
- Spot Gold is on the defensive on Tuesday, following a brief upswing in early market action.
- Medium- to long-term technicals remain unchanged, but a jump in near-term volatility could vex intraday traders.
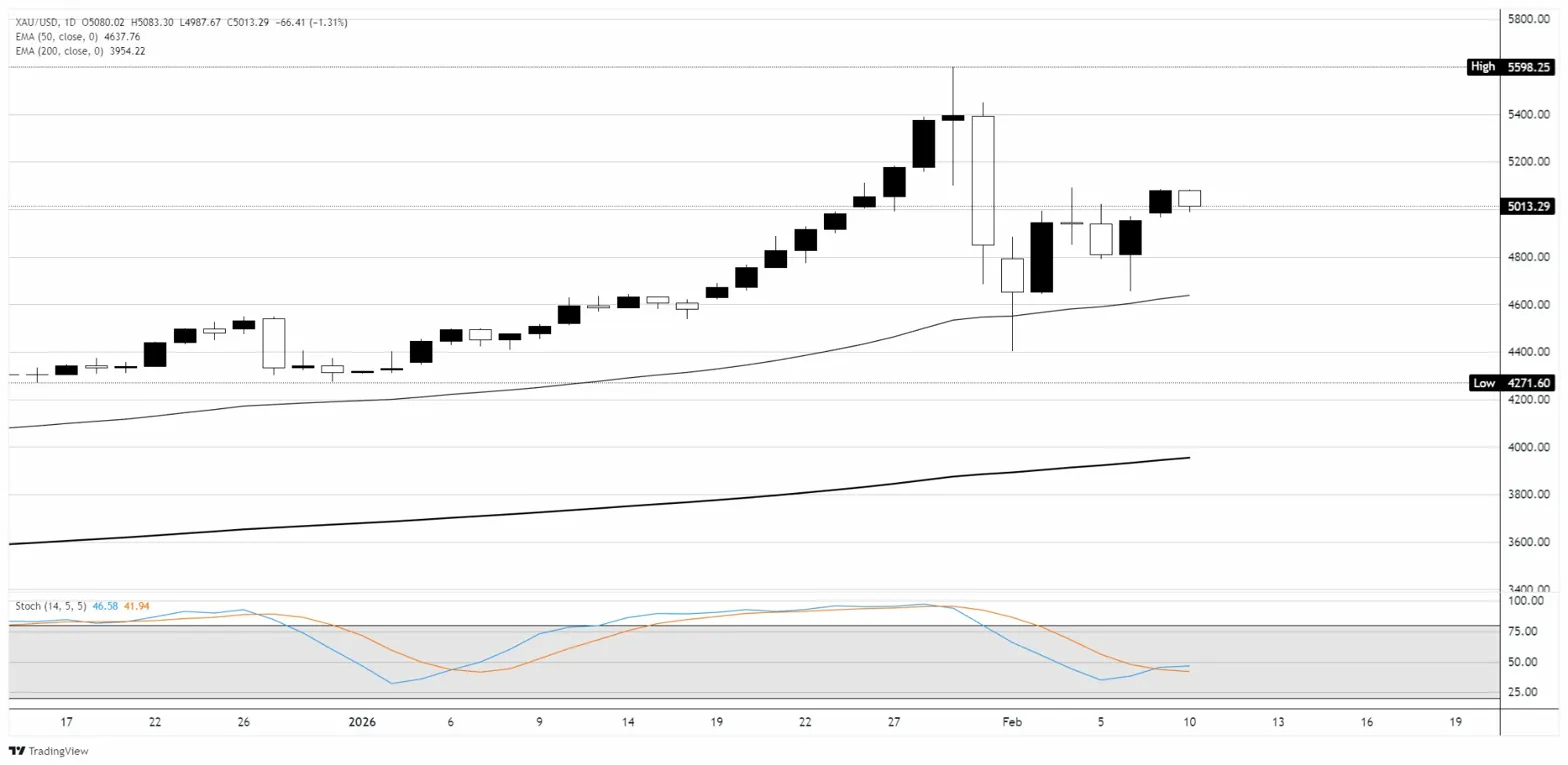
The daily chart for spot Gold shows a broad uptrend that is holding above both the 50-day Exponential Moving Average (EMA) at 4,637 and the 200-day EMA at 3,954, confirming the longer-term bullish structure. After printing an all-time high near 5,598 on January 29, price pulled back sharply and has since been consolidating in a range roughly between 4,800 and 5,100. Tuesday's session opened at 5,080 before selling off to a low of 4,987, with price currently trading around 5,013, down 1.31% on the day. The 5,000 psychological level is acting as near-term support, while the swing highs around 5,080 to 5,100 form immediate resistance. The pullback from the all-time high represents approximately a 38.2% Fibonacci retracement of the broader rally from the December 2025 lows, suggesting the correction is still within healthy territory for a trend continuation.
On the lower timeframes, the Stochastic Oscillator (14, 5, 5) has rolled over from overbought territory, with %K at 46.58 and %D at 41.94, pointing to fading short-term momentum and suggesting further downside pressure before a potential base forms. Price action on Tuesday displayed a bearish daily candle with a relatively narrow body, signaling indecision near the 5,000 handle. Today's US economic data added a bearish catalyst for the US Dollar, as December Retail Sales came in flat at 0.0% versus 0.4% expected, and the Employment Cost Index for Q4 printed at 0.7% versus 0.8% consensus. Weaker consumer spending data reinforces expectations for Federal Reserve (Fed) rate cuts later this year, which is structurally supportive for Gold. A sustained hold above 5,000 opens the door for a recovery toward the 5,100 to 5,150 resistance zone, while a daily close below 5,000 would expose the next support area near 4,935 to 4,880, where buyers stepped in during the early February correction.
XAU/USD daily chart
Gold FAQs
Gold has played a key role in human’s history as it has been widely used as a store of value and medium of exchange. Currently, apart from its shine and usage for jewelry, the precious metal is widely seen as a safe-haven asset, meaning that it is considered a good investment during turbulent times. Gold is also widely seen as a hedge against inflation and against depreciating currencies as it doesn’t rely on any specific issuer or government.
Central banks are the biggest Gold holders. In their aim to support their currencies in turbulent times, central banks tend to diversify their reserves and buy Gold to improve the perceived strength of the economy and the currency. High Gold reserves can be a source of trust for a country’s solvency. Central banks added 1,136 tonnes of Gold worth around $70 billion to their reserves in 2022, according to data from the World Gold Council. This is the highest yearly purchase since records began. Central banks from emerging economies such as China, India and Turkey are quickly increasing their Gold reserves.
Gold has an inverse correlation with the US Dollar and US Treasuries, which are both major reserve and safe-haven assets. When the Dollar depreciates, Gold tends to rise, enabling investors and central banks to diversify their assets in turbulent times. Gold is also inversely correlated with risk assets. A rally in the stock market tends to weaken Gold price, while sell-offs in riskier markets tend to favor the precious metal.
The price can move due to a wide range of factors. Geopolitical instability or fears of a deep recession can quickly make Gold price escalate due to its safe-haven status. As a yield-less asset, Gold tends to rise with lower interest rates, while higher cost of money usually weighs down on the yellow metal. Still, most moves depend on how the US Dollar (USD) behaves as the asset is priced in dollars (XAU/USD). A strong Dollar tends to keep the price of Gold controlled, whereas a weaker Dollar is likely to push Gold prices up.
Recommended Articles


