


Precious Metals: Gold and Silver Resonate, Bullish on the Outlook
Sharp Drop in Precious Metals Recently
From January 29 to February 2, the international precious metals market witnessed violent oscillations with wide price swings. International gold prices once surged sharply, edging close to the high of $5,600 per ounce; they then embarked on a steep decline immediately after the rally. As of now, spot gold is quoted at $4,683.56 per ounce, with a cumulative drop of approximately 16%. Over the same period, the silver market followed a similar trajectory: prices plummeted from $122 per ounce to the current $82.51 per ounce, representing a staggering 32% decline—double the drop in gold prices.
The sharp pullback in precious metal prices this time is attributable to the combined resonance of multiple factors. First, the excessive short-term gains and overly rapid uptrend of gold and silver prices in the previous period prompted long positions to take profits at high levels, creating phased selling pressure. Second, the Federal Reserve kept its benchmark interest rate unchanged at its January monetary policy meeting and signaled a hawkish policy tilt, which exerted direct downward pressure on precious metal asset prices. Third, the sharp decline in the U.S. stock market spurred market demand for liquidity, with investors selling off their gold and silver positions to recall capital, ultimately triggering a stampede-like sell-off in the market. Nevertheless, our analysis indicates that the sharp decline in the international precious metals market this time is a technical correction rather than a trend reversal, and we expect the gold and silver markets to sustain their long-term uptrend throughout 2026.
Figure: Gold Price (USD/oz, 1-hour Chart)
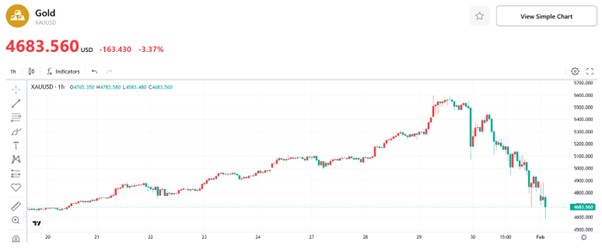
Source: TradingKey
Figure: Silver Price (USD/oz, 1-hour Chart)
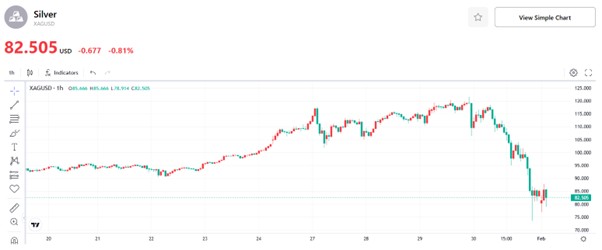
Source: TradingKey
The Gold Market
First, an analysis of the gold market performance: Looking back at 2025, geopolitical risks escalated continuously, uncertainty in the global economic operation rose markedly, and this was coupled with intensified policy games among major economies. Driven by these multiple factors, capital flowed into the gold market on a large scale, and gold’s value as a core safe-haven asset and a diversified allocation target became further prominent. On January 29, 2026, the World Gold Council (WGC) released its 2025 Global Gold Demand Trends Report. Data showed that the total global gold demand in 2025 reached 5,002 tonnes, a new all-time high. Among the figures, global gold investment demand surged to 2,175 tonnes, breaking the key 2,000-tonne mark for the first time and hitting a milestone high; the annual net inflows of global gold ETFs stood at 801 tonnes, ranking the second-highest annual increase in history.
Over the same period, demand for physical gold investment also performed strongly. In 2025, global demand for gold bars and coins reached 1,374 tonnes, corresponding to a value of approximately $154 billion, a 12-year high. Notably, continuous gold purchases by central banks worldwide emerged as a key pillar of gold demand. In 2025, global central banks and governmental institutions added a combined 863 tonnes of gold to their reserves, a volume significantly above the long-term average and one of the core drivers fueling global gold demand.
From a long-term perspective, the multipolar evolution of the international reserve asset system has entered a new phase driven by gold as the core driver since 2022. Following the outbreak of the Russia-Ukraine conflict, the US and Western countries imposed joint financial sanctions on Russia, which posed severe challenges to the security of traditional foreign exchange reserve assets. This external shock has directly accelerated the advancement of the multipolarization of the international reserve asset system. By the end of the third quarter of 2025, the global share of gold reserves had surged by 11.9 percentage points compared with the end of 2021, a rise significantly outpacing the 8.9 percentage point drop in the share of US dollar reserves over the same period. Meanwhile, the shares of the other five major reserve currencies all declined to varying degrees. Notably, the scale of gold reserves has surpassed that of the euro to become the world’s second-largest international reserve asset after the US dollar since the fourth quarter of 2023. By the end of the third quarter of 2025, the shares of the three major reserve assets—the US dollar, gold and the euro—stood at 42.3%, 25.7% and 15.1% respectively. It is evident that from the perspective of long-term development trends, an upward trend in global gold demand has been firmly established.
Looking ahead to 2026, the core logic underpinning the long-term uptrend in the gold market has not seen a fundamental reversal. At the same time, the core driving logic of the current gold bull market—the shift from the traditional interest rate anchor to a credit anchor—is also unlikely to change this year. Within the classic analytical framework for gold prices, real interest rates and the US Dollar Index have typically served as the core dimensions for judgment. However, during the evolution of the current market cycle, the traditional negative correlation between gold prices, real interest rates and the US Dollar Index has weakened markedly. This market characteristic signals a fundamental shift in the driving logic of gold prices.
The core connotation of the credit anchor emphasized at this stage is reflected in the market’s comprehensive revaluation of the global monetary and fiscal credit system. The market is now re-examining the stability of the US dollar-centric global monetary system and the sustainability of fiscal conditions in major economies. The current reality of elevated US fiscal deficits and a continuously rising debt stock has sparked widespread market concerns over the long-term purchasing power of the US dollar and US fiscal credit. As the ultimate store of value that is free from sovereign credit constraints, gold’s core attribute as a credit hedge is undergoing a market repricing, with its value further reinforced.
From a short-term perspective, our baseline scenario for gold prices is a continuation of the uptrend, driven primarily by market expectations for accommodative policies and marginal shifts in risk appetite. The Federal Reserve is highly likely to sustain its rate-cut cycle in 2026, a policy stance that will provide liquidity-driven support for the upside in gold prices. Meanwhile, a further escalation of geopolitical risks or heightened volatility in the global financial markets could trigger a renewed release of safe-haven demand for gold, creating an upward price impetus.
From a long-term perspective, gold prices still have substantial upside potential. The key question dominating current market attention is when the end of this gold bull market cycle will arrive. Based on an analysis of historical trend patterns, two core signals serve as definitive indicators for judging the end of a bull market: first, a substantive shift in the Federal Reserve’s monetary policy, with a formal entry into a tightening cycle and a full exit from the current accommodative monetary policy framework; second, the emergence of a pivotal inflection point toward a trend of improvement in the US economic fundamentals, with a clear move into a prosperous phase of economic recovery or reflation.
Until the above two fundamental reversal signals materialize, factors such as the various related issues stemming from the expansion of US debt stock and the phased adjustments to the pace of gold purchases by global central banks will mostly only trigger marginal fluctuations in gold prices at the equilibrium pricing level, and will be unable to drive a fundamental shift in the bull-bear cycle of the gold market. In summary, the core logic and underpinnings supporting the long-term rise of gold assets remain solid and have not suffered any substantive erosion.
The Silver Market
A detailed analysis of the silver market first requires clarifying its attribute differences from gold. A review of historical trends shows that while gold and silver prices generally move up and down in tandem, silver prices exhibit significantly higher volatility. Specifically, three key distinctions stand out:
First, silver has a far stronger commodity attribute than gold, with a broader range of industrial applications, and industrial demand accounts for a substantial share of its overall demand structure. Second, although silver has a long history as a monetary asset, this attribute has weakened markedly in the current era, and its safe-haven characteristic is notably inferior to that of gold. Amid systemic risks, high inflation, currency credit crises and other such scenarios, silver prices move upward in tandem with gold; yet once the crisis eases, its safe-haven attribute quickly recedes to a secondary position, and the commodity attribute regains its role as the core driver of price trends. Third, silver’s financial attribute endows its price with greater elasticity. Due to characteristics such as a lower unit price and larger price swings, silver easily attracts a large number of short-term speculators and momentum traders. As a result, its price often experiences violent surges and slumps driven by speculative trading.
The sharp rally in silver prices during this cycle is driven primarily by the upward resonance of industrial and financial demand. In terms of its attributes, silver prices are dominated by its commodity attribute, with relatively low elasticity on the supply side; industrial demand, in particular, serves as the core variable determining its price trend. Over the long term, silver prices are highly correlated with the global industrial cycle: during periods of economic prosperity and industrial production expansion, rising industrial demand for silver acts as a tailwind for its price; conversely, a contraction in industrial demand exerts significant downward pressure on silver prices.
In recent years, the rapid development of emerging industries such as photovoltaics, new energy vehicles and AI servers has created structural and sustainable demand growth for silver. A supply-demand deficit in the global silver market first emerged in 2020 and has persisted through 2025, a supply-demand dynamic that has become a key fundamental factor underpinning the uptrend in silver prices.
On the other hand, silver’s financial attribute further amplifies its price volatility, which is manifested in three aspects: First, when investors substantially increase their long futures positions, the combination of capital inflows, the transmission of bullish sentiment and leverage effects exerts a significant upward pull on silver prices. Second, the position locking mechanism of silver ETFs reduces the volume of tradable physical silver in the market, which is prone to creating and even exacerbating a short squeeze in the market. Third, regional silver hoarding has been continuously curbing the supply of free-flowing silver globally. Since 2011, India has persistently stockpiled silver through import channels, with a portion of silver resources withdrawing from the international circulation and financial trading system, which has further intensified the structural supply tightness in the physical silver market.
Looking ahead to 2026, silver prices will continue to be supported by multiple factors, which can be analyzed from three dimensions: First, the sustained development of emerging industries such as photovoltaics, new energy vehicles and AI servers is creating structurally sustainable growth in industrial demand for silver, forming the core fundamental support for the upside in silver prices. Second, gold and silver prices exhibit a synchronous trend. Since 2022, the continuous gold purchases by global central banks have effectively driven up gold prices. We judge that central bank gold buying will feature a long-term and sustainable trajectory, a trend that reflects the restructuring of the global monetary system amid the shifting trust foundation among major economies. Currently, the share of gold reserves in emerging economies still lags significantly behind that in advanced economies, and their gold purchase pace is expected to further accelerate in the future, thereby driving a concomitant rise in silver prices. Third, the asset attribute of silver is gradually rising on a global scale. In November 2025, the United States Geological Survey (USGS) included silver in its Critical Minerals List for the first time, driving its upgrade from a conventional commodity to a strategic asset. In September 2024, Russia already classified silver as a foreign exchange reserve asset. In April 2026, the Reserve Bank of India (RBI) issued a new regulation allowing silver to be used as collateral for banks and non-banking financial institutions (NBFIs). Against this backdrop, some economies are expected to further increase their silver reserves, which will form a long-term and stable underpinning for silver prices.
From a historical perspective on the gold-silver ratio, the two market cycles in 2020 and 2022 both saw gold prices surge sharply while silver price gains lagged phasedly, causing the ratio to deviate from its long-term average range. Subsequently, silver prices staged a catch-up rally, which gradually drove the gold-silver ratio back toward a reasonable range. In Q1 2025, COMEX silver inventories rebounded sharply, and combined with silver price gains once again underperforming those of gold, the gold-silver ratio moved upward in a phased manner. Starting from Q2, silver prices embarked on a pronounced catch-up trend, leading to a rapid pullback in the ratio. To date, the gold-silver ratio has corrected sharply as silver prices have recorded a significantly steeper decline than gold. Looking ahead to the subsequent trend, it is expected that by the end of 2026, the gains in gold and silver prices will most likely tend to balance out, forming a pattern of concerted upward movement for both prices. Based on this, we judge that the gold-silver ratio will fluctuate within the low range of 46-58.
Figure: Gold-Silver Ratio
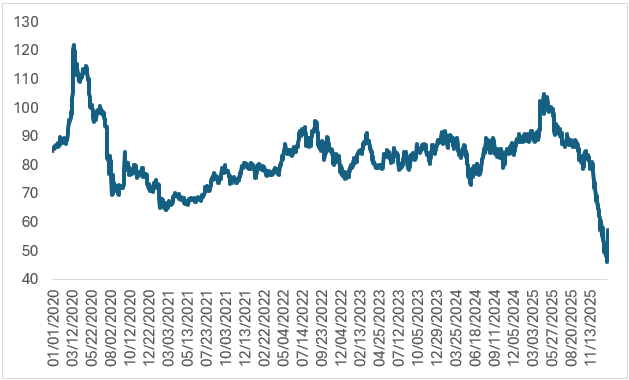
Source: Refinitiv, TradingKey
Conclusion
In summary, the sharp decline in international precious metal prices this time is highly likely a short-term, phased correction. Driven by the combined effects of multiple factors—including the ongoing interest rate cut cycle by major global central banks, the deepening de-dollarization trend, and the sustained increase in gold holdings by central banks, enterprises and individual investors—global gold demand is expected to remain robust in 2026, which will in turn underpin and drive up gold prices. Against the backdrop of the price resonance in the gold and silver markets, silver prices are poised to move upward in tandem with gold. In addition, with the steady and sustained development of emerging industries such as photovoltaics, new energy vehicles and AI servers, industrial demand for silver is expected to achieve continuous growth in 2026, providing bullish support for its price.
Recommended Articles


