EUR/USD price analysis: Pair drifts lower amid bearish pressure

Source Fxstreet
  • EUR/USD trades near the 1.11 zone with minor losses on Friday.
  • The pair maintains a bearish outlook, supported by mixed technical signals.
  • Key support is clustered below 1.1150, with resistance near 1.1200.

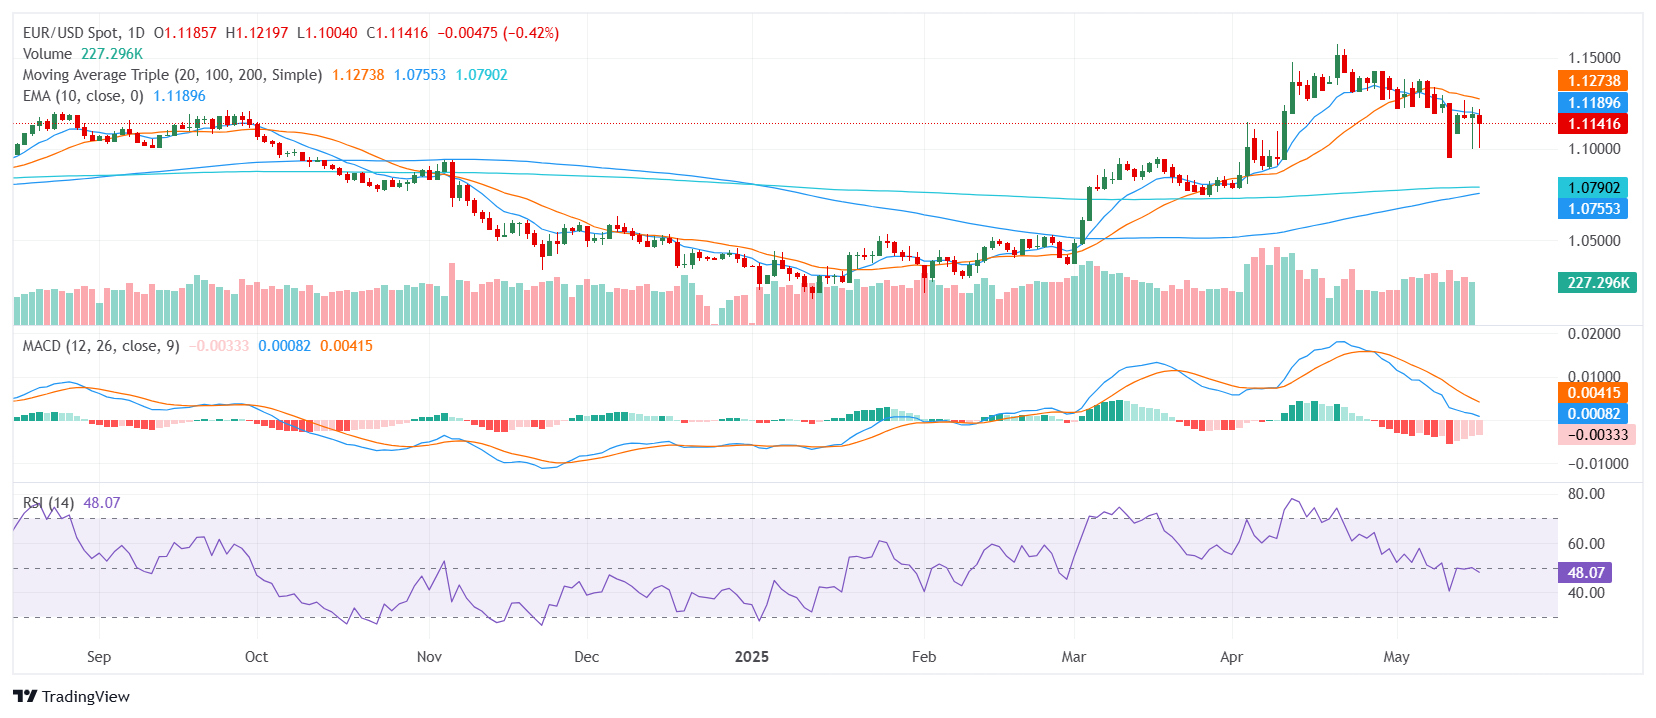
The EUR/USD pair is under modest selling pressure on Friday, moving near the lower end of its daily range around the 1.11 zone. This positioning reflects a bearish tone, reinforced by a cluster of short-term technical indicators that favor downside momentum, despite some mixed signals from longer-term trends. As the European session wraps up, traders appear cautious, aligning with the broader risk-off sentiment in the market.

EUR/USD currently maintains a bearish bias, as highlighted by the alignment of its short-term moving averages. The 10-period Exponential Moving Average (EMA) and the 10-period Simple Moving Average (SMA) both point lower, signaling near-term selling pressure. The 20-day Simple Moving Average (SMA) also supports this bearish view, adding weight to the downside outlook. In contrast, the longer-term 100-day and 200-day SMAs indicate a more supportive backdrop, suggesting that the broader trend remains mixed.

Momentum indicators present a similarly cautious picture. The Relative Strength Index (RSI) hovers around the 40 area, indicating neutral momentum, while the Moving Average Convergence Divergence (MACD) clearly favors selling, adding to the pair's downside risk. The Average Directional Index (14) is in the 30s, further confirming the bearish tone, while the Ultimate Oscillator (7, 14, 28) remains in neutral territory, reflecting the current indecision among traders. The Awesome Oscillator also mirrors this neutrality, failing to provide a clear directional cue.

Looking ahead, immediate support is found around 1.1144, with additional levels near 1.1106 and 1.1094. On the upside, resistance is likely to emerge around 1.1193, followed closely by 1.1209 and 1.1222, potentially capping any recovery attempts as the pair struggles to break out of its current downtrend.

Daily Chart
Disclaimer: For information purposes only. Past performance is not indicative of future results.
placeholder
Gold price stalls recovery from over one-month low near 200-period SMA on H4Gold price (XAU/USD) struggles to capitalize on the previous day's strong recovery move from the $3,120 region, or the lowest level since April 10, and attracts some sellers during the Asian session on Friday.
Author  FXStreet
16 hours ago
Gold price (XAU/USD) struggles to capitalize on the previous day's strong recovery move from the $3,120 region, or the lowest level since April 10, and attracts some sellers during the Asian session on Friday.
placeholder
XRP Price Sinks Lower, But Chart Whisperers See a Trap for The BearsXRP price started a downside correction below the $2.50 zone. The price is now consolidating and might find bids near the $2.350 support zone. XRP price started a fresh decline below the $2.550 zone.
Author  NewsBTC
16 hours ago
XRP price started a downside correction below the $2.50 zone. The price is now consolidating and might find bids near the $2.350 support zone. XRP price started a fresh decline below the $2.550 zone.
placeholder
EUR/USD rebounds to near 1.1200 ahead of UoM Consumer Sentiment Index releaseEUR/USD has recovered its daily losses, trading around 1.1200 during the Asian hours on Friday. The pair receives support as the US Dollar (USD) weakens following the recent economic data released on Thursday.
Author  FXStreet
16 hours ago
EUR/USD has recovered its daily losses, trading around 1.1200 during the Asian hours on Friday. The pair receives support as the US Dollar (USD) weakens following the recent economic data released on Thursday.
placeholder
Ripple Price Forecast: XRP rally faces uncertainty after Court denies SEC-Ripple joint motionRipple (XRP) price trades broadly sideways at around $2.41 on Friday, rising slightly after a minor correction from this week’s peak of $2.65 to support $2.34.
Author  FXStreet
16 hours ago
Ripple (XRP) price trades broadly sideways at around $2.41 on Friday, rising slightly after a minor correction from this week’s peak of $2.65 to support $2.34.
placeholder
US Dollar Index (DXY) Price Forecast: Seems vulnerable near 100.70; break below 200-period SMA on H4 awaitedThe US Dollar Index (DXY), which tracks the Greenback against a basket of currencies, trades with a negative bias for the second straight day on Friday, though the intraday downtick lacks bearish conviction.
Author  FXStreet
16 hours ago
The US Dollar Index (DXY), which tracks the Greenback against a basket of currencies, trades with a negative bias for the second straight day on Friday, though the intraday downtick lacks bearish conviction.
Related Instrument
goTop
quote