EUR/CHF price analysis: Cross struggles amid mixed technical signals

Source Fxstreet
  • EUR/CHF was seen around the 0.94 zone on Friday, with minor gains.
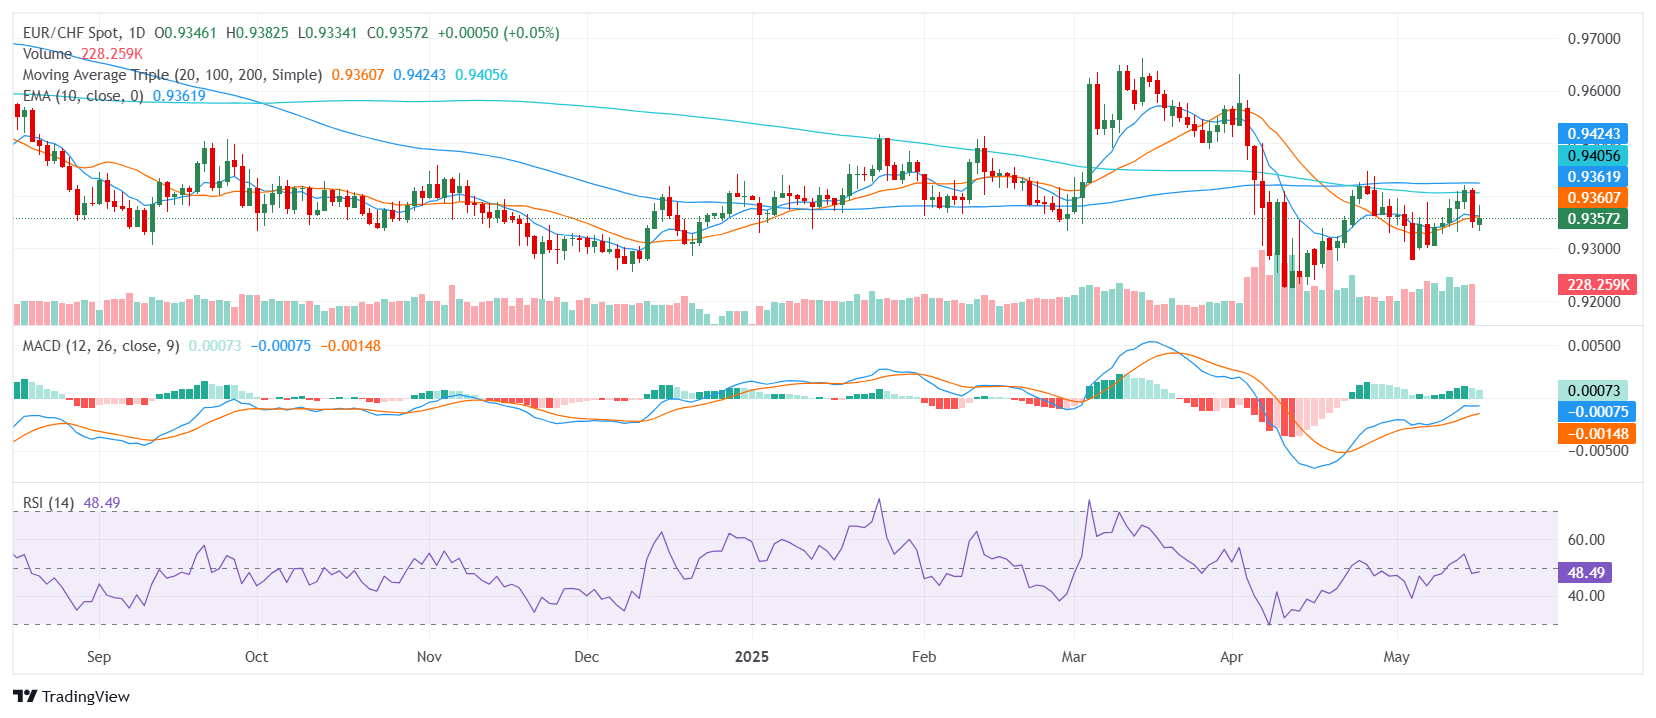
  • The cross maintains a bearish bias despite mixed technical signals.
  • Key support is clustered below the 0.9350 level, with resistance near 0.9360.

The EUR/CHF pair is navigating a cautious tone on Friday, hovering around the 0.94 zone with modest gains. Despite the slight recovery, the broader technical outlook remains tilted to the downside, reflecting persistent selling pressure that has kept the pair within a tight range in recent sessions. Mixed signals from momentum indicators suggest a complex short-term outlook, reinforcing the cautious sentiment among traders.

EUR/CHF continues to exhibit a bearish overall structure, as suggested by the alignment of its 20, 100, and 200-day Simple Moving Averages (SMAs), which all point to downward pressure. These longer-term trend indicators confirm the broader selling bias. The Relative Strength Index (RSI) remains in the 40s, reflecting neutral conditions that align with the current sideways price action. Meanwhile, the Moving Average Convergence Divergence (MACD) signals a slight buy momentum, contrasting with the prevailing bearish sentiment.

Adding to the mixed technical landscape, the Momentum (10) indicator hovers around the 0 level, suggesting mild buying interest, while both the Ultimate Oscillator (7, 14, 28) and the Stochastic %K (14, 3, 3) rest in the 50s, indicating a largely neutral stance. This combination of signals underlines the current indecision in the market, as traders weigh the potential for a near-term rebound against the longer-term bearish trend.

For now, immediate support is expected around 0.9353, with additional layers at 0.9341 and 0.9334. On the upside, resistance is likely to emerge around 0.9362, followed closely by 0.9363 and 0.9364, potentially capping any recovery attempts in the near term.

Daily Chart

Disclaimer: For information purposes only. Past performance is not indicative of future results.
placeholder
Gold price stalls recovery from over one-month low near 200-period SMA on H4Gold price (XAU/USD) struggles to capitalize on the previous day's strong recovery move from the $3,120 region, or the lowest level since April 10, and attracts some sellers during the Asian session on Friday.
Author  FXStreet
15 hours ago
Gold price (XAU/USD) struggles to capitalize on the previous day's strong recovery move from the $3,120 region, or the lowest level since April 10, and attracts some sellers during the Asian session on Friday.
placeholder
XRP Price Sinks Lower, But Chart Whisperers See a Trap for The BearsXRP price started a downside correction below the $2.50 zone. The price is now consolidating and might find bids near the $2.350 support zone. XRP price started a fresh decline below the $2.550 zone.
Author  NewsBTC
15 hours ago
XRP price started a downside correction below the $2.50 zone. The price is now consolidating and might find bids near the $2.350 support zone. XRP price started a fresh decline below the $2.550 zone.
placeholder
EUR/USD rebounds to near 1.1200 ahead of UoM Consumer Sentiment Index releaseEUR/USD has recovered its daily losses, trading around 1.1200 during the Asian hours on Friday. The pair receives support as the US Dollar (USD) weakens following the recent economic data released on Thursday.
Author  FXStreet
15 hours ago
EUR/USD has recovered its daily losses, trading around 1.1200 during the Asian hours on Friday. The pair receives support as the US Dollar (USD) weakens following the recent economic data released on Thursday.
placeholder
Ripple Price Forecast: XRP rally faces uncertainty after Court denies SEC-Ripple joint motionRipple (XRP) price trades broadly sideways at around $2.41 on Friday, rising slightly after a minor correction from this week’s peak of $2.65 to support $2.34.
Author  FXStreet
15 hours ago
Ripple (XRP) price trades broadly sideways at around $2.41 on Friday, rising slightly after a minor correction from this week’s peak of $2.65 to support $2.34.
placeholder
US Dollar Index (DXY) Price Forecast: Seems vulnerable near 100.70; break below 200-period SMA on H4 awaitedThe US Dollar Index (DXY), which tracks the Greenback against a basket of currencies, trades with a negative bias for the second straight day on Friday, though the intraday downtick lacks bearish conviction.
Author  FXStreet
15 hours ago
The US Dollar Index (DXY), which tracks the Greenback against a basket of currencies, trades with a negative bias for the second straight day on Friday, though the intraday downtick lacks bearish conviction.
goTop
quote