


USD/INR edges lower as Indian Rupee gains on improving equity inflows
- USD/INR declines as the Rupee finds support from tentative signs of improving equity inflows.
- Foreign investors bought about $250 million on Monday into Indian markets.
- The US and India reached a broad trade deal, with India committing over $500 billion in purchases.
USD/INR loses ground on Tuesday after two days of gains. However, the Indian Rupee (INR) struggled against the US Dollar (USD) in the previous session, with bankers citing hedging activity and routine local flows.
However, the INR may find support from tentative signs of improving equity inflows, as foreign investors bought around $250 million of Indian shares on Monday, lifting total monthly purchases to about $1.5 billion. This compares with nearly $4 billion in outflows recorded in January, according to Reuters.
The downside of the Indian Rupee was limited amid the United States (US)–India interim trade framework. New Delhi and Washington on Friday unveiled an interim framework aimed at lowering tariffs, reshaping energy ties, and deepening economic cooperation. The announcement follows a breakthrough in prolonged negotiations earlier last week and helped lift the Rupee to its strongest weekly gain in more than three years, according to Reuters.
The US and India reached a wide-ranging trade agreement involving India buying more than $500 billion in purchases, tariff reductions, and provisions on digital trade, significantly reshaping bilateral commercial relations. India will also eliminate or lower tariffs on US industrial products and a broad spectrum of agricultural goods, with reductions covering food items such as grains, edible oils, fruit, wine and spirits.
US Dollar declines as sentiment improves ahead of looming data
- The US Dollar Index (DXY), which measures the value of the US Dollar (USD) against six major currencies, extends its losses for the third successive session and is trading near 96.80 at the time of writing.
- Traders await the delayed January US employment report and upcoming CPI data, which are expected to shape views on economic cooling and the timing of potential Federal Reserve easing.
- Market sentiment has improved ahead of a heavy slate of US data due this week, helping assess economic health and refine expectations for the Fed’s policy path. Markets anticipate the Fed will hold rates in March, with a first cut likely in June and a possible follow-up in September.
- US inflation expectations eased, with median one-year-ahead inflation expectations falling to 3.1% in January, the lowest in six months, from 3.4% in December. Food price expectations were unchanged at 5.7%, while three- and five-year expectations remained steady at 3%.
- Markets currently expect the Fed to keep interest rates unchanged in March, with potential rate cuts anticipated in June and possibly September. San Francisco Fed President Mary Daly said in a LinkedIn post on Friday that the economy may remain in a low-hiring, low-firing environment, though it could also shift toward a no-hiring, higher-firing phase.
- Fed Governor Phillip Jefferson said future policy decisions will be guided by incoming data and assessments of the economic outlook, adding on Friday that the labor market is gradually stabilizing. Meanwhile, Atlanta Fed President Raphael Bostic noted that inflation has remained elevated for too long, stressing in a Bloomberg interview on Friday that the Fed cannot lose sight of inflationary risks.
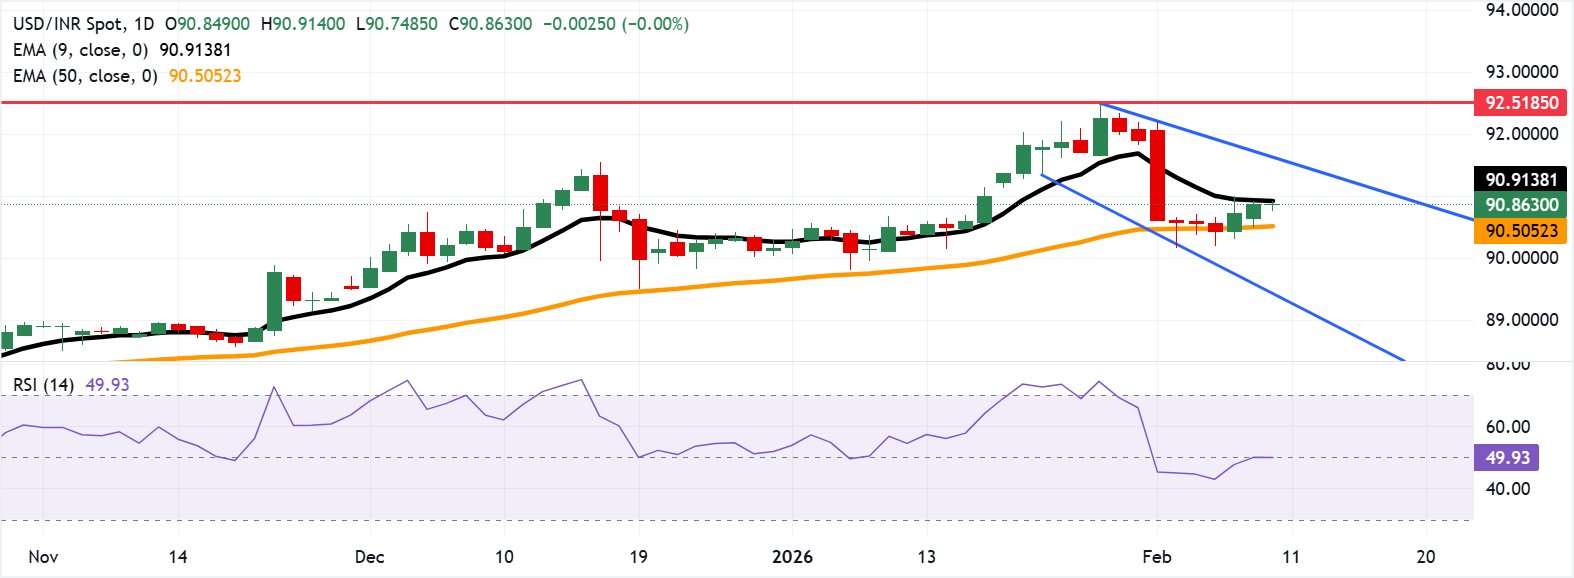
USD/INR remains below nine-day EMA near 91.00
USD/INR is trading around 90.80 at the time of writing. Daily chart analysis points to an ongoing bearish bias, with the pair trading within a descending channel pattern. The 14-day Relative Strength Index (RSI) at 48 (neutral-bearish) reflects cooling momentum after recent overbought readings. Near-term resistance aligns at 90.8912, while support is seen at 90.5008.
The initial support lies at the 50-day Exponential Moving Average (EMA) at 90.50. A break below the medium-term price momentum will expose the lower boundary of the descending channel around 89.50. On the upside, the immediate resistance is seen at the nine-day EMA at 90.90. Further advances would lead the pair to approach the upper channel boundary around 91.70, followed by the January 28 all-time high of 92.51.
(The technical analysis of this story was written with the help of an AI tool.)
US Dollar Price Today
The table below shows the percentage change of US Dollar (USD) against listed major currencies today. US Dollar was the strongest against the Australian Dollar.
| USD | EUR | GBP | JPY | CAD | AUD | NZD | INR | |
|---|---|---|---|---|---|---|---|---|
| USD | 0.00% | 0.03% | -0.47% | -0.07% | 0.21% | 0.20% | -0.03% | |
| EUR | 0.00% | 0.03% | -0.46% | -0.07% | 0.21% | 0.20% | -0.03% | |
| GBP | -0.03% | -0.03% | -0.49% | -0.10% | 0.18% | 0.17% | -0.06% | |
| JPY | 0.47% | 0.46% | 0.49% | 0.40% | 0.67% | 0.66% | 0.44% | |
| CAD | 0.07% | 0.07% | 0.10% | -0.40% | 0.27% | 0.26% | 0.04% | |
| AUD | -0.21% | -0.21% | -0.18% | -0.67% | -0.27% | -0.01% | -0.25% | |
| NZD | -0.20% | -0.20% | -0.17% | -0.66% | -0.26% | 0.00% | -0.22% | |
| INR | 0.03% | 0.03% | 0.06% | -0.44% | -0.04% | 0.25% | 0.22% |
The heat map shows percentage changes of major currencies against each other. The base currency is picked from the left column, while the quote currency is picked from the top row. For example, if you pick the US Dollar from the left column and move along the horizontal line to the Japanese Yen, the percentage change displayed in the box will represent USD (base)/JPY (quote).
Indian Rupee FAQs
The Indian Rupee (INR) is one of the most sensitive currencies to external factors. The price of Crude Oil (the country is highly dependent on imported Oil), the value of the US Dollar – most trade is conducted in USD – and the level of foreign investment, are all influential. Direct intervention by the Reserve Bank of India (RBI) in FX markets to keep the exchange rate stable, as well as the level of interest rates set by the RBI, are further major influencing factors on the Rupee.
The Reserve Bank of India (RBI) actively intervenes in forex markets to maintain a stable exchange rate, to help facilitate trade. In addition, the RBI tries to maintain the inflation rate at its 4% target by adjusting interest rates. Higher interest rates usually strengthen the Rupee. This is due to the role of the ‘carry trade’ in which investors borrow in countries with lower interest rates so as to place their money in countries’ offering relatively higher interest rates and profit from the difference.
Macroeconomic factors that influence the value of the Rupee include inflation, interest rates, the economic growth rate (GDP), the balance of trade, and inflows from foreign investment. A higher growth rate can lead to more overseas investment, pushing up demand for the Rupee. A less negative balance of trade will eventually lead to a stronger Rupee. Higher interest rates, especially real rates (interest rates less inflation) are also positive for the Rupee. A risk-on environment can lead to greater inflows of Foreign Direct and Indirect Investment (FDI and FII), which also benefit the Rupee.
Higher inflation, particularly, if it is comparatively higher than India’s peers, is generally negative for the currency as it reflects devaluation through oversupply. Inflation also increases the cost of exports, leading to more Rupees being sold to purchase foreign imports, which is Rupee-negative. At the same time, higher inflation usually leads to the Reserve Bank of India (RBI) raising interest rates and this can be positive for the Rupee, due to increased demand from international investors. The opposite effect is true of lower inflation.
Recommended Articles


