


EUR/JPY Price Forecast: Hovers around 174.00 after breaking below the nine-day EMA
- EUR/JPY tests the immediate barrier at the psychological level of 174.00.
- The 14-day Relative Strength Index stays above 50, reinforcing the bullish outlook.
- The currency cross may find its primary support at the ascending channel’s lower boundary around 172.90.
EUR/JPY extends its losses for the third successive session, trading near 174.00 during the Asian hours on Thursday. The currency cross remains subdued ahead of German Retail Sales, Unemployment, and flash Consumer Price Index (CPI) data from Germany due later in the day.
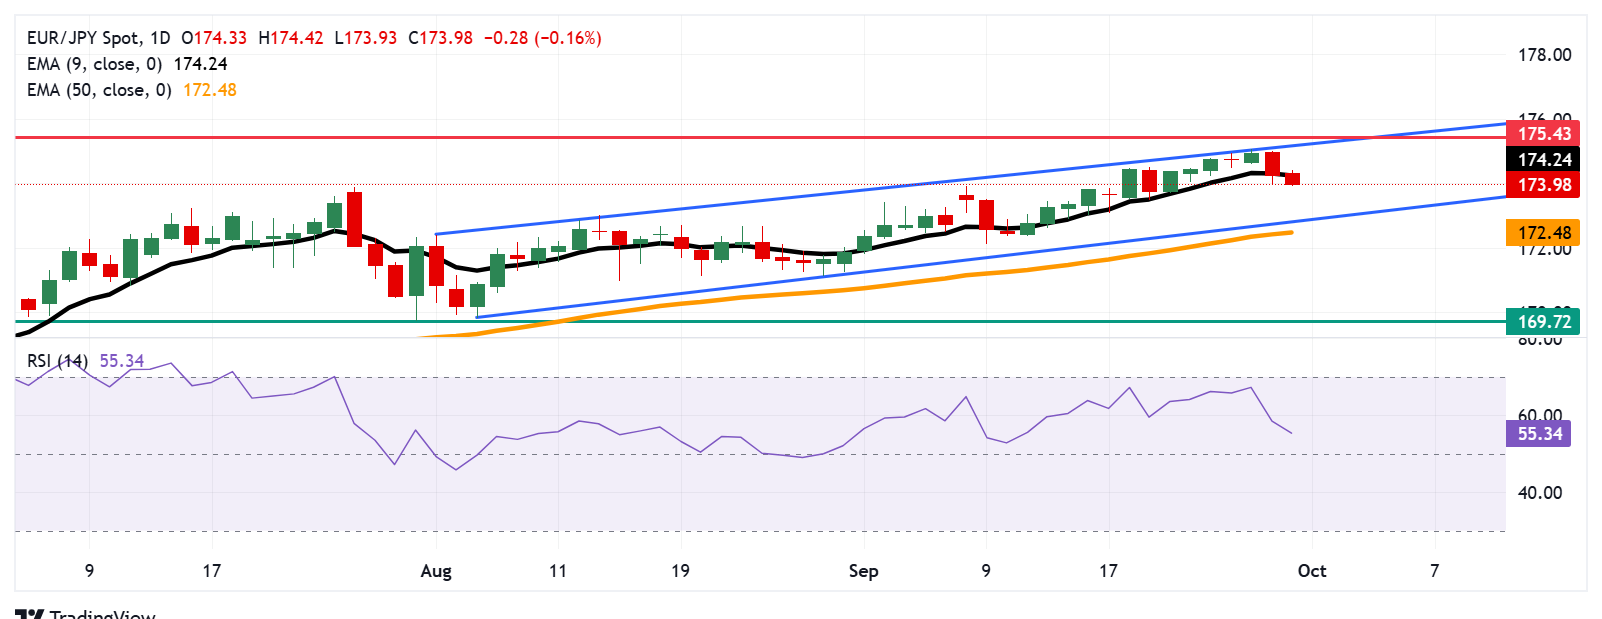
The technical analysis of the daily chart indicates an ongoing bullish bias as the currency cross remains within the ascending channel pattern. The 14-day Relative Strength Index (RSI) is positioned above the 50 mark, strengthening the bullish bias. However, the short-term price momentum is weaker as the EUR/JPY cross has moved below the nine-day Exponential Moving Average (EMA).
On the upside, a successful break above the psychological level of 174.00 would prompt the EUR/JPY cross to test the nine-day EMA of 174.25. Further advances would support the currency cross to explore the region around the upper boundary of the ascending channel at 175.20, followed by the all-time high of 175.43, reached in July 2024.
The initial support lies at the ascending channel’s lower boundary around 172.90, followed by the 50-day EMA at 172.48. A break below this crucial support zone would cause the emergence of the bearish bias and put downward pressure on the EUR/JPY cross to navigate the area around the two-month low of 169.72, which was recorded on July 31.
EUR/JPY: Daily Chart
Euro Price Today
The table below shows the percentage change of Euro (EUR) against listed major currencies today. Euro was the weakest against the Australian Dollar.
| USD | EUR | GBP | JPY | CAD | AUD | NZD | CHF | |
|---|---|---|---|---|---|---|---|---|
| USD | -0.05% | -0.05% | -0.25% | -0.00% | -0.46% | -0.27% | -0.08% | |
| EUR | 0.05% | -0.03% | -0.21% | 0.02% | -0.42% | -0.22% | -0.01% | |
| GBP | 0.05% | 0.03% | -0.16% | 0.07% | -0.41% | -0.20% | 0.02% | |
| JPY | 0.25% | 0.21% | 0.16% | 0.21% | -0.22% | 0.14% | 0.20% | |
| CAD | 0.00% | -0.02% | -0.07% | -0.21% | -0.46% | -0.24% | -0.05% | |
| AUD | 0.46% | 0.42% | 0.41% | 0.22% | 0.46% | 0.20% | 0.43% | |
| NZD | 0.27% | 0.22% | 0.20% | -0.14% | 0.24% | -0.20% | 0.23% | |
| CHF | 0.08% | 0.00% | -0.02% | -0.20% | 0.05% | -0.43% | -0.23% |
The heat map shows percentage changes of major currencies against each other. The base currency is picked from the left column, while the quote currency is picked from the top row. For example, if you pick the Euro from the left column and move along the horizontal line to the US Dollar, the percentage change displayed in the box will represent EUR (base)/USD (quote).
Recommended Articles


