


GBP/JPY Price Analysis: Stays below 200.00 near nine-day EMA ahead of UK CPI data
- GBP/JPY is challenging the key psychological resistance at 200.00.
- The 14-day Relative Strength Index remains above 50, signaling a bullish bias.
- The initial support lies at the nine-day EMA of 199.79.
GBP/JPY faces challenges for the second successive day, trading around 199.90 during the Asian hours on Wednesday. The currency cross depreciates as the Pound Sterling (GBP) struggles against its peers ahead of the United Kingdom’s (UK) Consumer Price Index (CPI) and Retail Price Index data. Focus will shift toward the US Federal Reserve (Fed) policy decision due later in the day.
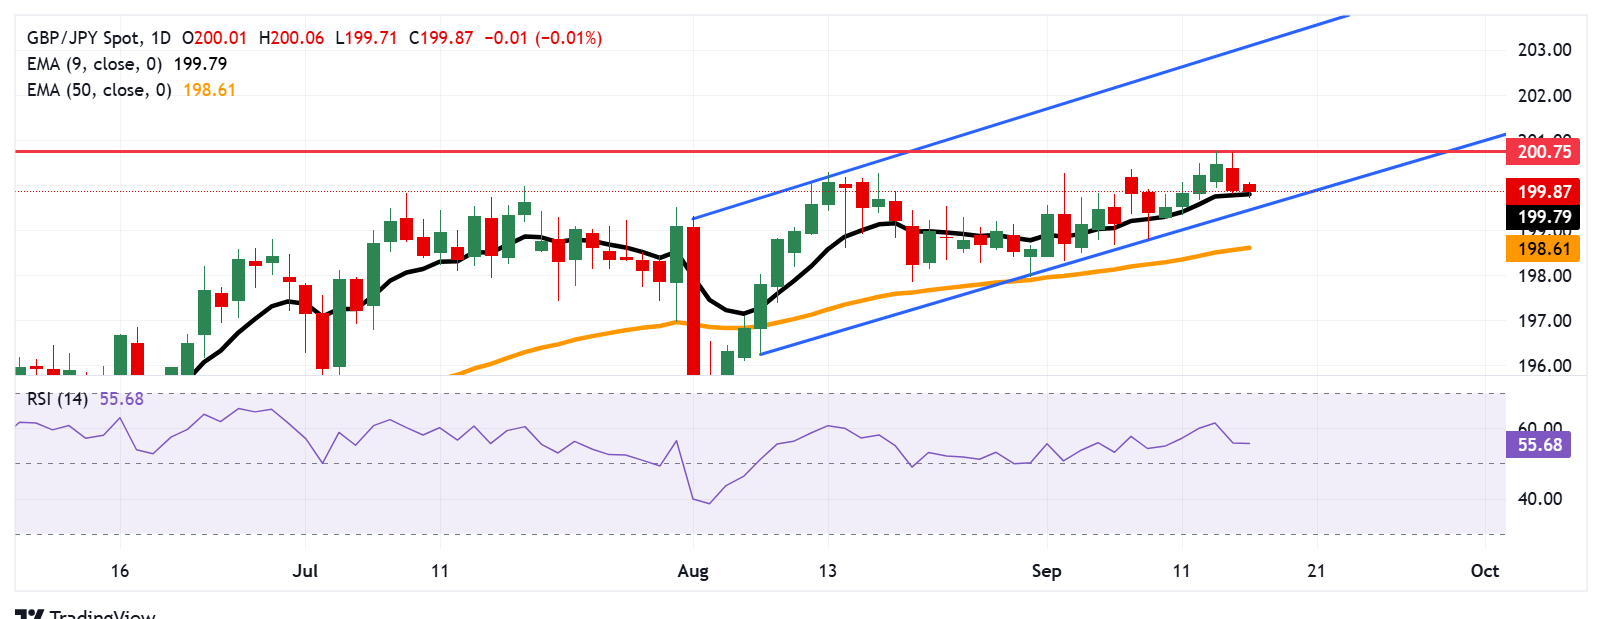
However, a look at the daily chart suggested the GBP/JPY cross is remaining within an ascending channel pattern, suggesting the market sentiment is bullish. The 14-day Relative Strength Index (RSI), a key momentum gauge, is positioned slightly above the 50 mark, signaling bullish bias is in play. Additionally, the currency cross is remaining above the nine-day Exponential Moving Average (EMA), suggesting the market sentiment is stronger.
On the upside, the GBP/JPY cross is testing its immediate barrier at the psychological level of 200.00, followed by the 200.75, the highest since July 2024, which was reached on September 15. A break above this level could lead the currency cross to explore the region around the ascending channel’s upper boundary at 203.10.
The immediate support appears at the nine-day EMA of 199.79, followed by the lower boundary of the ascending channel around 199.50. A break below the channel would weaken the bullish bias and put downward pressure on the GBP/JPY cross to test the 50-day EMA at 198.61.
GBP/JPY: Daily Chart
Pound Sterling Price Today
The table below shows the percentage change of British Pound (GBP) against listed major currencies today. British Pound was the weakest against the US Dollar.
| USD | EUR | GBP | JPY | CAD | AUD | NZD | CHF | |
|---|---|---|---|---|---|---|---|---|
| USD | 0.13% | 0.05% | 0.04% | 0.08% | 0.05% | 0.06% | 0.17% | |
| EUR | -0.13% | -0.09% | -0.10% | -0.02% | 0.05% | 0.06% | 0.04% | |
| GBP | -0.05% | 0.09% | 0.00% | 0.07% | -0.01% | 0.01% | 0.05% | |
| JPY | -0.04% | 0.10% | 0.00% | 0.04% | 0.12% | 0.03% | -0.01% | |
| CAD | -0.08% | 0.02% | -0.07% | -0.04% | 0.04% | 0.03% | 0.05% | |
| AUD | -0.05% | -0.05% | 0.01% | -0.12% | -0.04% | 0.03% | -0.02% | |
| NZD | -0.06% | -0.06% | -0.01% | -0.03% | -0.03% | -0.03% | -0.00% | |
| CHF | -0.17% | -0.04% | -0.05% | 0.00% | -0.05% | 0.02% | 0.00% |
The heat map shows percentage changes of major currencies against each other. The base currency is picked from the left column, while the quote currency is picked from the top row. For example, if you pick the British Pound from the left column and move along the horizontal line to the US Dollar, the percentage change displayed in the box will represent GBP (base)/USD (quote).
Recommended Articles


