




NZD/USD (NZDUSD) is down 0.58% on Sep 10: The Reason Has Emerged
NZD/USD (NZDUSD) is down 0.58% at Sep 10 08:35(ET), now at $0.58022, with a 7-day down of 1.30%.
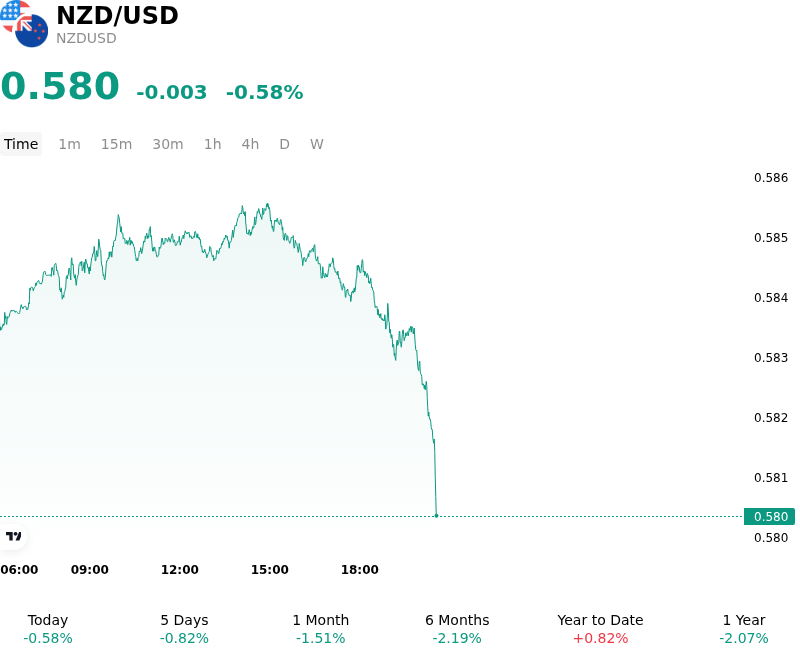
What is driving NZD/USD (NZDUSD)’s stock price down today?
The decline in the New Zealand dollar against the U.S. dollar was primarily driven by a widening divergence in monetary policy expectations between the Reserve Bank of New Zealand and the Federal Reserve, alongside a broader pullback in global risk sentiment. Although the RBNZ recently delivered a 25 basis point rate hike to 2.75 percent, market participants continued to digest dovish forward guidance from domestic policymakers. With New Zealand's economic recovery remaining patchy, unemployment elevated, and core inflation showing signs of moderating when excluding energy shocks, investors increasingly priced in a high likelihood of a rate pause at the central bank's upcoming October meeting. This measured trajectory capped short-term yield support for the Kiwi, leaving the currency vulnerable to relative repricing against the greenback.
On the quote side of the pair, the U.S. dollar gained firm traction as traders repositioned ahead of key U.S. inflation data releases, including the Producer Price Index and Consumer Price Index. Stronger-than-expected U.S. nonfarm payrolls data from the preceding session reinforced market expectations that the Federal Reserve might maintain a hawkish stance or deliver an additional rate hike at its upcoming policy gathering. Firming U.S. Treasury yields provided solid underlying support for the U.S. dollar, widening interest-rate differentials in favor of U.S. assets over New Zealand fixed-income securities.
Geopolitical tensions and sustained strength in global energy prices further dented overall risk appetite, exerting additional pressure on high-beta and commodity-linked currencies like the New Zealand dollar. High oil prices and elevated sovereign bond yields kept equity sentiment muted, encouraging institutional flows to migrate toward the safety of the U.S. dollar.
Overall, the intraday movement in NZDUSD represents an event-driven adjustment to shifting rate expectations and elevated macro risk aversion. Unless U.S. inflation indicators surprise materially to the downside or domestic New Zealand economic data re-accelerates, the pair is likely to remain constrained by persistent monetary policy differentials and fragile global risk sentiment.
Technical Analysis of NZD/USD (NZDUSD)
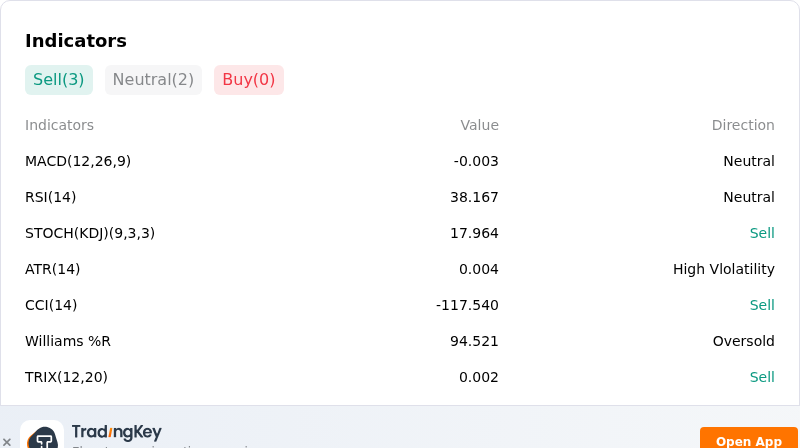
Technically, NZD/USD (NZDUSD) shows a MACD (12,26,9) value of -0.003, indicating a neutral signal. The RSI at 38.167 suggests neutral condition and the Williams %R at 94.521 suggests oversold condition. Please monitor closely.
More details about NZD/USD (NZDUSD)
Recent Events and Risks:
- RBNZ Dovish Policy Guidance: Cautious monetary policy signals from the Reserve Bank of New Zealand following its recent interest rate decision have capped rate-hike expectations, as policymakers highlighted weak domestic consumption and elevated unemployment at 5.6%, eroding monetary policy support for the Kiwi dollar.
- US Yield Resurgence and Inflation Anxiety: Elevated US Treasury yields and market caution ahead of upcoming US inflation and wholesale price data continue to underpin the US Dollar, narrowing interest rate differentials and keeping NZD/USD under steady downward pressure.
- Elevated Energy Costs and Risk-Off Sentiment: High global crude oil prices driven by Middle East geopolitical friction serve as a negative terms-of-trade shock for New Zealand as a net energy importer, while broader risk-averse market sentiment weighs heavily on the risk-sensitive New Zealand Dollar.
- Technical Support Erosion: NZD/USD remains trapped below its 200-day moving average near 0.5855 and is probing crucial support around the 0.5800 level, exposing the pair to potential automated stop-loss selling and accelerated downside toward the 0.5760 region if support fails.
Recommended Articles


