


Top 3 Price Prediction: Bitcoin, Ethereum, Ripple – BTC, ETH and XRP show signs of recovery


Bitcoin price is nearing its key resistance of $106,400; a firm close above suggests a recovery is on the cards.
Ethereum bounces off its 200-day EMA, indicating strong support and potential for further upside.
XRP is nearing its key resistance at $2.27; a daily close above could catalyze a recovery trend.
Bitcoin (BTC), Ethereum (ETH) and Ripple (XRP) are showing signs of recovery after a period of consolidation and bearish pressure. BTC, ETH and XRP prices rebound slightly, approaching their key resistance levels; a daily close above could open the door for further upside.
Bitcoin price could revive rally if it closes above $106,400
Bitcoin price declined and closed below its daily level of $106,406 last week. However, it recovered slightly during the weekend and also on Monday. BTC faced resistance again around the $106,406 level the next day. At the time of writing on Wednesday, it recovers slightly, approaching this resistance level.
If BTC recovers and closes above $106,406, it could extend the rally toward its all-time high of $111,980.
The Relative Strength Index (RSI) on the daily chart reads 54 and points upwards after rebounding from its neutral level of 50, indicating bullish momentum is gaining traction.
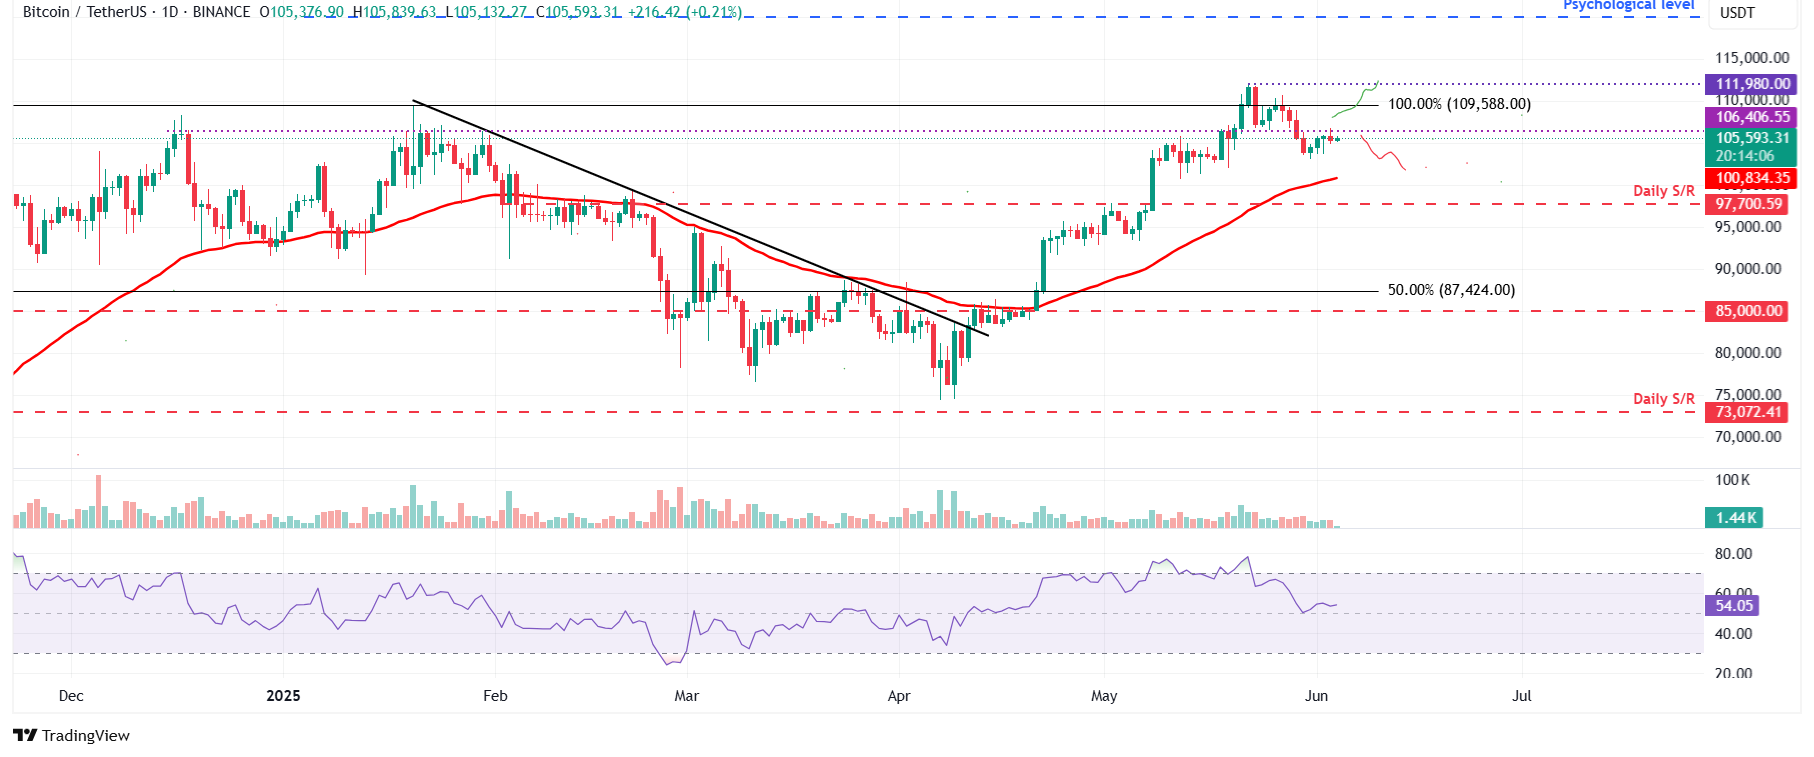
BTC/USDT daily chart
However, if BTC fails to close above the $106,406 daily resistance, it could extend the decline to retest its next key support level at $100,000, a psychological level.
Ethereum price could bounce higher as the 200-day EMA remains strong
Ethereum price has been consolidating between $2,461 and $2,724, its 200-day EMA and daily resistance levels, respectively, for 26 consecutive days. At the time of writing on Wednesday, it trades slightly above, nearing its upper consolidation level at $2,724.
If ETH breaks and closes above its upper consolidation level at $2,724, it could extend the rally toward its psychologically important level at $3,000.
The RSI on the daily chart reads 62, above its neutral level of 50, indicating bullish momentum.
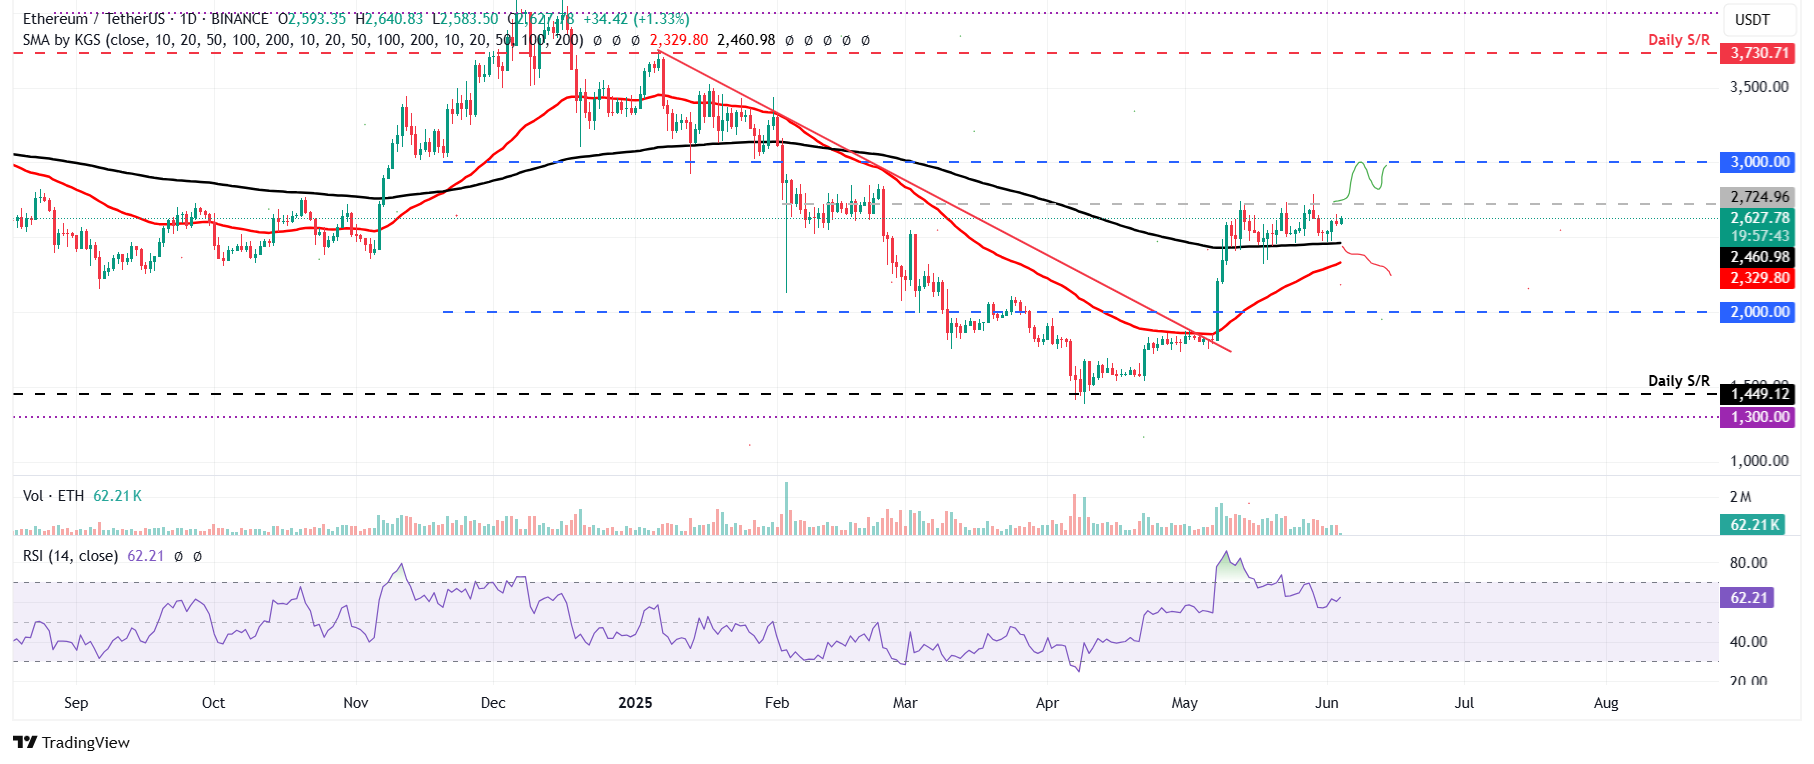
ETH/USDT daily chart
However, if the 200-day EMA at $2,461 fails to hold as support, ETH could extend the decline to retest its next support level at $2,329, its 50-day EMA.
XRP price could recover if it closes above its 50-day EMA
XRP price closed below its daily support at $2.23 on Friday and declined by 4.65%. However, it recovered from its fall in the next four days. At the time of writing on Wednesday, it is approaching its key resistance at $2.23.
If XRP breaks above the $2.23 level and closes above its 50-day EMA at $2.27, it could extend the recovery to retest its next resistance level at $2.72.
The RSI on the daily chart reads 47 and points upward toward its neutral level of 50, indicating a weakening of bearish momentum.
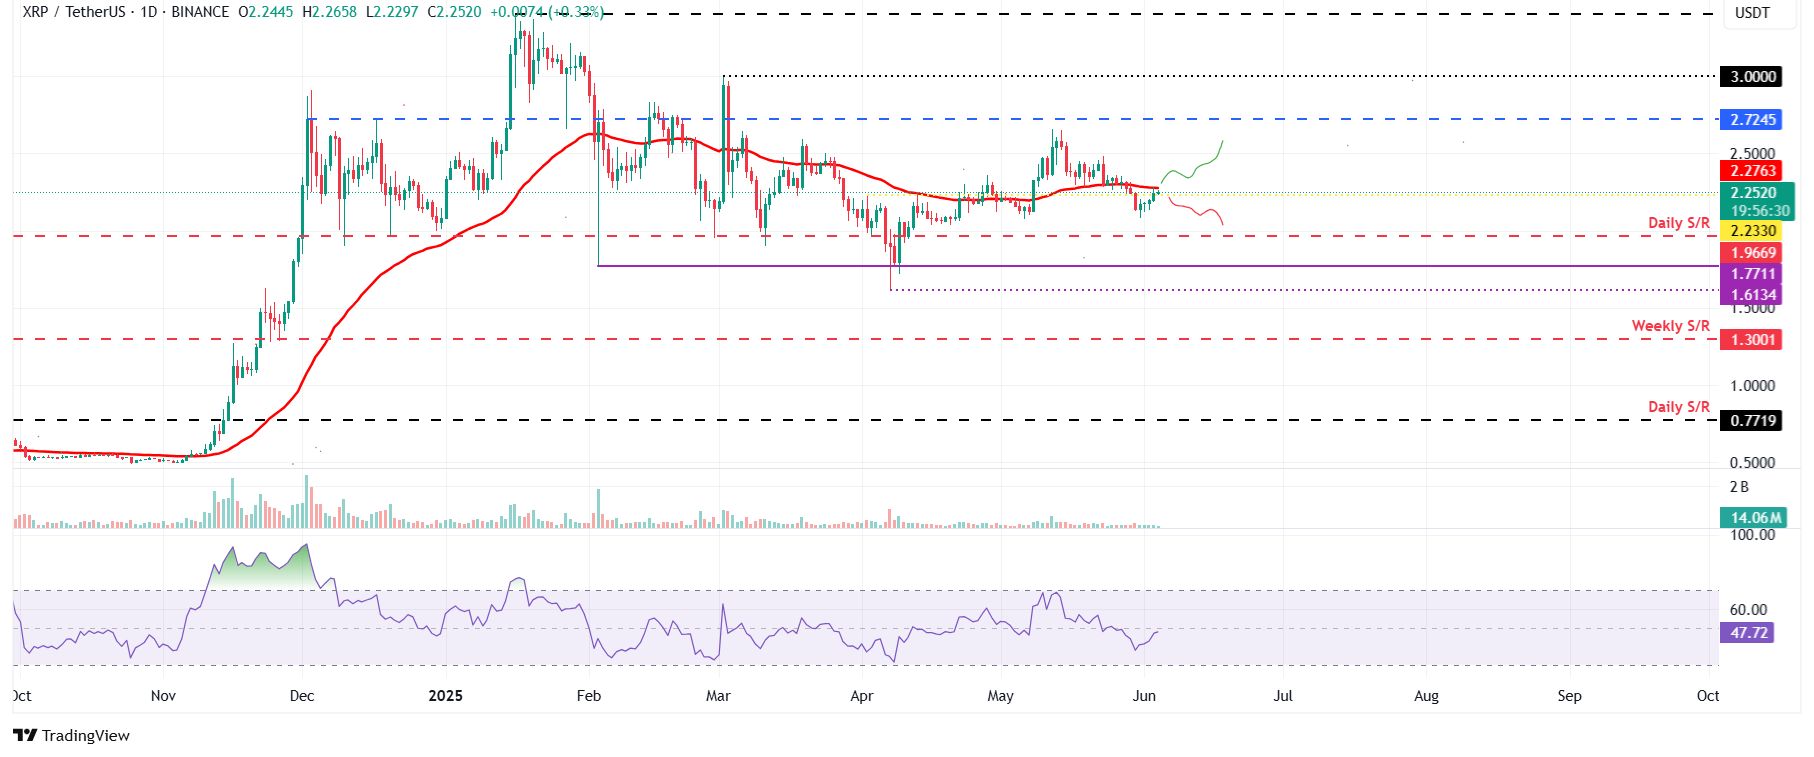
XRP/USDT daily chart
On the other hand, if XRP faces rejection from its $2.23 level, it could extend the decline to retest its next daily support at $1.96.
* The content presented above, whether from a third party or not, is considered as general advice only. This article should not be construed as containing investment advice, investment recommendations, an offer of or solicitation for any transactions in financial instruments.


