
US Dollar edges lower after Taiwan Dollar surges amid exporter panic
- The US Dollar edges lower on Monday’s trading.
- TWD surges over 5% in a very illiquid market while the Taiwanese central bank holds an emergency press conference.
- The US Dollar Index remains capped below 100.00 and is still stuck in a wait-and-see range.
The US Dollar Index (DXY), which tracks the performance of the US Dollar (USD) against six major currencies, edges lower and remains capped below the 100.00 level at the time of writing on Monday after the Taiwan Dollar (TWD) surges over 5% and triggers a spillover effect in Asian currencies against the Greenback. It is the biggest intraday gain in over three decades, on speculation that exporters are rushing to convert their holdings of US Dollars to the island’s currency, according to Bloomberg. All this occurs in a very illiquid market with several Asian countries, such as China, and the United Kingdom, closed for a public holiday.
The move opens up an interesting element in the tariff talks that are taking place between the United States (US) and Taiwan. One of the reasons exporters are buying Taiwan Dollars is that they expect the authorities will allow the currency to appreciate to help reach a trade deal with the US. Taiwan’s government said Saturday its negotiation team had conducted the first round of meetings with the US on May 1, though no details were released.
Daily digest market movers: A lot of moving parts again
- On Sunday, US President Donald Trump suggested that his administration could strike trade deals with some countries as soon as this week, offering the prospect of relief for trading partners seeking to avoid higher US import duties, Reuters reported.
- The European Union is set to propose measures to ban Russian Gas imports by the end of 2027, as the bloc pushes to sever ties with the country that was once its biggest energy supplier, Bloomberg reports.
- Japan's Finance Minister Katsunobu Kato said the country will not use the sale of its US Treasury holdings in trade talks with the Trump administration, retracting earlier statements from last week, Bloomberg reports.
- At 13:45 GMT, April's final reading of the S&P Global Services Purchase Managers’ Index (PMI) will be released. Expectations are for a steady 51.4 reading.
- At 14:00 GMT, the Institute for Supply Management (ISM) will release its April PMI for the Services sector:
- The Services PMI headline is expected to dip to 50.6, coming from 50.8 in March.
- The Services New Orders Index was at 50.4 and the Services Employment Index at 46.2 in March, with no forecasts for April available.
- Equities are all over the place while several countries in Asia remain closed for a public holiday. European indexes are up around 0.50% on the day. US futures look under pressure with the Nasdaq down near 1%.
- The CME FedWatch tool shows the chance of an interest rate cut by the Federal Reserve in May's meeting stands at 3.2% against a 96.8% probability of no change. The June meeting sees a 31.8% chance of a rate cut.
- The US 10-year yields trade around 4.31%, erasing past weeks’ softening as traders have even priced out the chances for a June rate cut.
US Dollar Index Technical Analysis: Outside pressure
The US Dollar Index (DXY) is moving due to a bunch of spillover and domino effects from the Taiwan Dollar. Although it is not part of the Index, other currencies in the Asian region follow, with the Japanese Yen (JPY), which accounts for 13.6% of the DXY, currently trading nearly 1% stronger against the Greenback. A side effect of the demands from the Trump administration, urging exporting countries to appreciate their currency as one of the demands to avoid tariffs, hits. In turn, this revaluation weakens the Greenback, and this was only Taiwan.
On the upside, the DXY’s first resistance comes in at 100.22, which supported the DXY back in September 2024, with a break back above the 100.00 round level as a bullish signal. A firm recovery would be a return to 101.90, which acted as a pivotal level throughout December 2023 and again as a base for the inverted head-and-shoulders (H&S) formation during the summer of 2024.
On the other hand, the 97.73 support could quickly be tested on any substantial bearish headline. Further below, a relatively thin technical support comes in at 96.94 before looking at the lower levels of this new price range. These would be at 95.25 and 94.56, meaning fresh lows not seen since 2022.
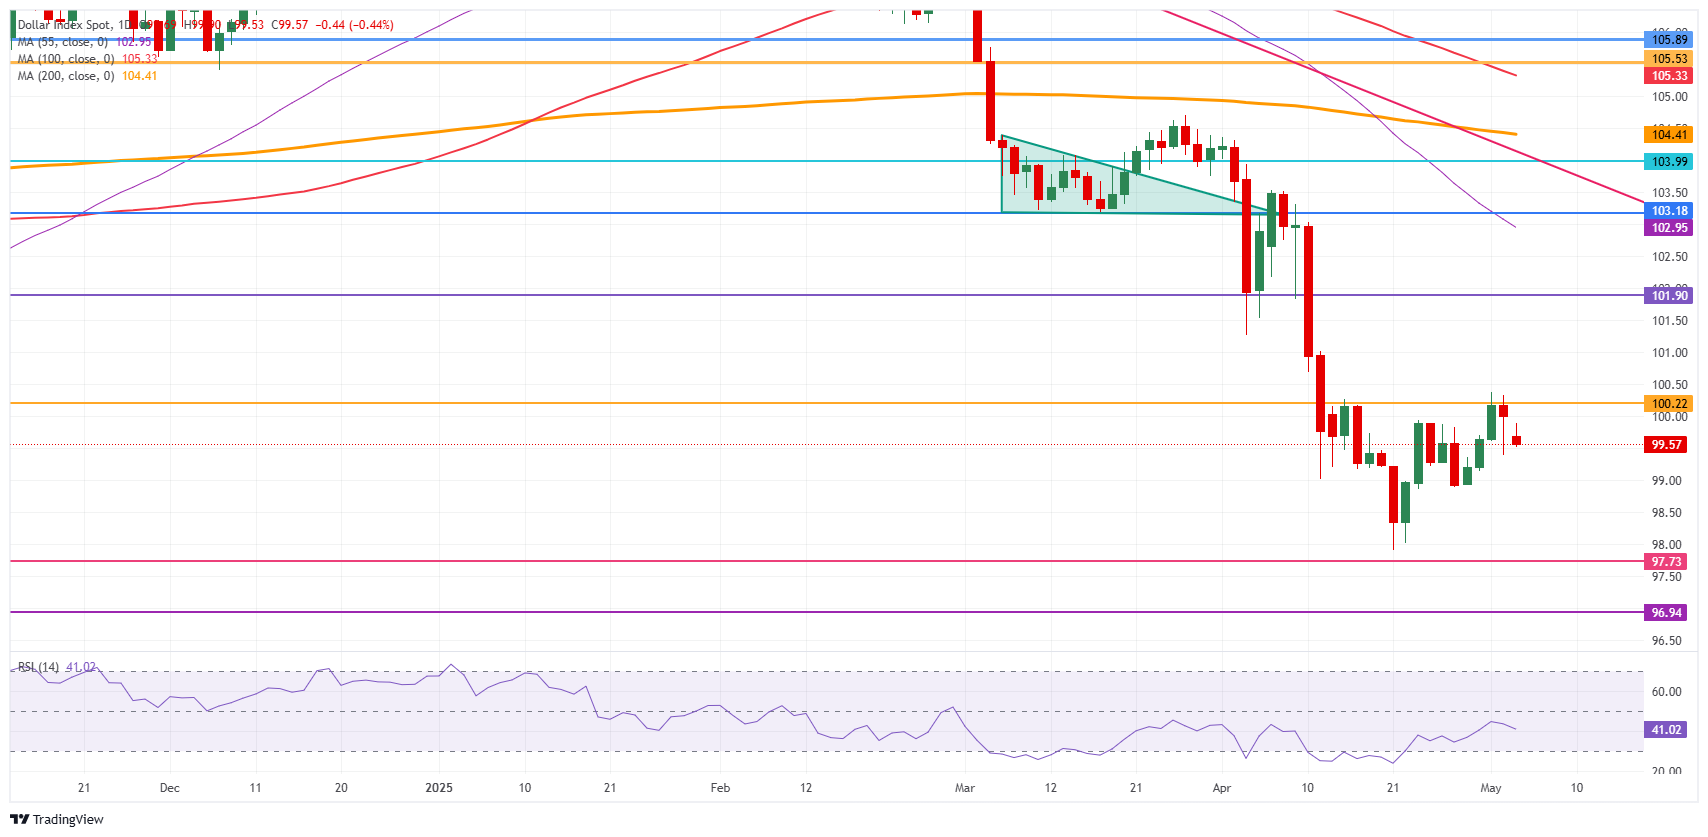
US Dollar Index: Daily Chart
US-China Trade War FAQs
Generally speaking, a trade war is an economic conflict between two or more countries due to extreme protectionism on one end. It implies the creation of trade barriers, such as tariffs, which result in counter-barriers, escalating import costs, and hence the cost of living.
An economic conflict between the United States (US) and China began early in 2018, when President Donald Trump set trade barriers on China, claiming unfair commercial practices and intellectual property theft from the Asian giant. China took retaliatory action, imposing tariffs on multiple US goods, such as automobiles and soybeans. Tensions escalated until the two countries signed the US-China Phase One trade deal in January 2020. The agreement required structural reforms and other changes to China’s economic and trade regime and pretended to restore stability and trust between the two nations. However, the Coronavirus pandemic took the focus out of the conflict. Yet, it is worth mentioning that President Joe Biden, who took office after Trump, kept tariffs in place and even added some additional levies.
The return of Donald Trump to the White House as the 47th US President has sparked a fresh wave of tensions between the two countries. During the 2024 election campaign, Trump pledged to impose 60% tariffs on China once he returned to office, which he did on January 20, 2025. With Trump back, the US-China trade war is meant to resume where it was left, with tit-for-tat policies affecting the global economic landscape amid disruptions in global supply chains, resulting in a reduction in spending, particularly investment, and directly feeding into the Consumer Price Index inflation.
Artigos Recomendados


