
Australian Dollar holds ground despite a weaker-than-expected Retail Sales MoM
- The Australian Dollar maintains its position despite a disappointing Retail Sales MoM for March.
- The AUD may come under pressure as renewed fears of a global economic slowdown weigh on commodity markets.
- Trump signaled potential trade agreements with India, Japan, and South Korea, and voiced optimism about reaching a resolution with China.
The Australian Dollar (AUD) is rebounding modestly against the US Dollar (USD) on Friday, retracing some of the previous session’s losses. However, the AUD/USD pair remains vulnerable as falling metal prices weigh on sentiment. Key commodities such as iron ore, copper, and gold declined amid renewed concerns over a global economic slowdown, pressuring the commodity-linked Aussie Dollar.
Adding to the pressure, signs of easing US trade tensions have supported the Greenback. Investor sentiment shifted after US President Donald Trump signaled potential trade deals with India, Japan, and South Korea, and expressed optimism about resolving tensions with China.
Australia’s Retail Sales—a key indicator of consumer spending—increased by 0.3% month-over-month in March, up from a 0.2% rise in February, according to data released Friday by the Australian Bureau of Statistics (ABS). However, the figure fell short of market expectations, which had forecast a 0.4% gain.
According to Bloomberg, China is considering renewed trade talks with the US. The Chinese Commerce Ministry noted that Washington has reached out to express interest in resuming negotiations. However, China is reportedly conducting an internal assessment and maintains that the US should correct its tariff-related actions, which it views as the unilateral trigger for the ongoing trade dispute.
Australia heads to the polls this weekend, and the outcome presents several risks for the Australian Dollar. Current polling slightly favors incumbent Prime Minister Anthony Albanese, but the race remains tight. A key concern is the possibility of Albanese winning only a minority, forcing him to form a government with the support of the Greens and/or independents—raising the risk of more expansive fiscal policies and potential fiscal slippage. Another short-term risk is the potential for a delayed result, with no clear outcome emerging for several days after the vote.
Meanwhile, inflationary pressures in Australia in early 2025 have weakened expectations of further monetary easing by the Reserve Bank of Australia (RBA). However, markets anticipate a 25-basis-point rate cut in May, as policymakers prepare for possible economic fallout from the recently introduced US tariffs.
Australian Dollar advances despite a stronger US Dollar due to cautious risk sentiment
- The US Dollar Index (DXY), which tracks the USD against a basket of six major currencies, is climbing for the fourth consecutive day, trading near 100.30 at the time of writing. Market sentiment remains cautious ahead of the upcoming Nonfarm Payrolls (NFP) report, as investors look for insight into how tariffs may be impacting employment trends.
- The Greenback is supported by cautious risk sentiment and yield dynamics. However, its broader gains remain limited as markets await Friday’s jobs data, particularly in light of softer-than-expected labor and manufacturing indicators.
- The ISM Manufacturing PMI slipped to 48.7 in April from 49.0, indicating continued contraction in the sector. While still below the 50.0 expansion threshold, the reading was better than expectations of 48.0.
- Initial Jobless Claims rose to 241,000 for the week ending April 26, above both the consensus forecast of 224,000 and the previous week’s revised figure of 223,000. Meanwhile, the Employment Index within the ISM survey showed a modest improvement, rising to 46.5 from 44.7. While still signaling declines in manufacturing employment, the pace of deterioration appears to be slowing.
- US President Donald Trump, during a NewsNation Town Hall interview early Thursday, expressed optimism about a potential trade agreement with China, stating there is a "very good probability we'll reach a deal." Trump emphasized that any agreement with China must meet US conditions. He also mentioned the possibility of future trade deals with India, South Korea, and Japan, and noted that a deal with Ukraine was finalized earlier in the day.
- The Australian Bureau of Statistics reported on Thursday a trade surplus of AUD 6.9 billion for March, significantly surpassing expectations of AUD 3.13 billion and the revised February figure of AUD 2.85 billion (down from AUD 2.97 billion). The strong surplus was driven by a 7.6% rise in exports and a 2.2% decline in imports for the month.
- On Wednesday, the Australian Bureau of Statistics (ABS) reported that the Consumer Price Index (CPI) rose by 0.9% quarter-over-quarter in Q1 2025, up from a 0.2% increase in Q4 2024 and exceeding market expectations of a 0.8% rise. On an annual basis, CPI climbed 2.4% in the first quarter, beating the forecast of 2.2%.
- Australian Treasurer Jim Chalmers noted that markets still anticipate further interest rate cuts. “The market expects more interest rate cuts after inflation figures,” he stated, adding that there’s “nothing in these numbers that would substantially alter market expectations.”
- In China, the National Bureau of Statistics (NBS) reported that the Manufacturing Purchasing Managers' Index (PMI) slipped to 49.0 in April from 50.5 in March, falling short of the 49.9 consensus and indicating a return to contraction. The Non-Manufacturing PMI also softened, easing to 50.4 in April from 50.8 in March, below the expected 50.7.
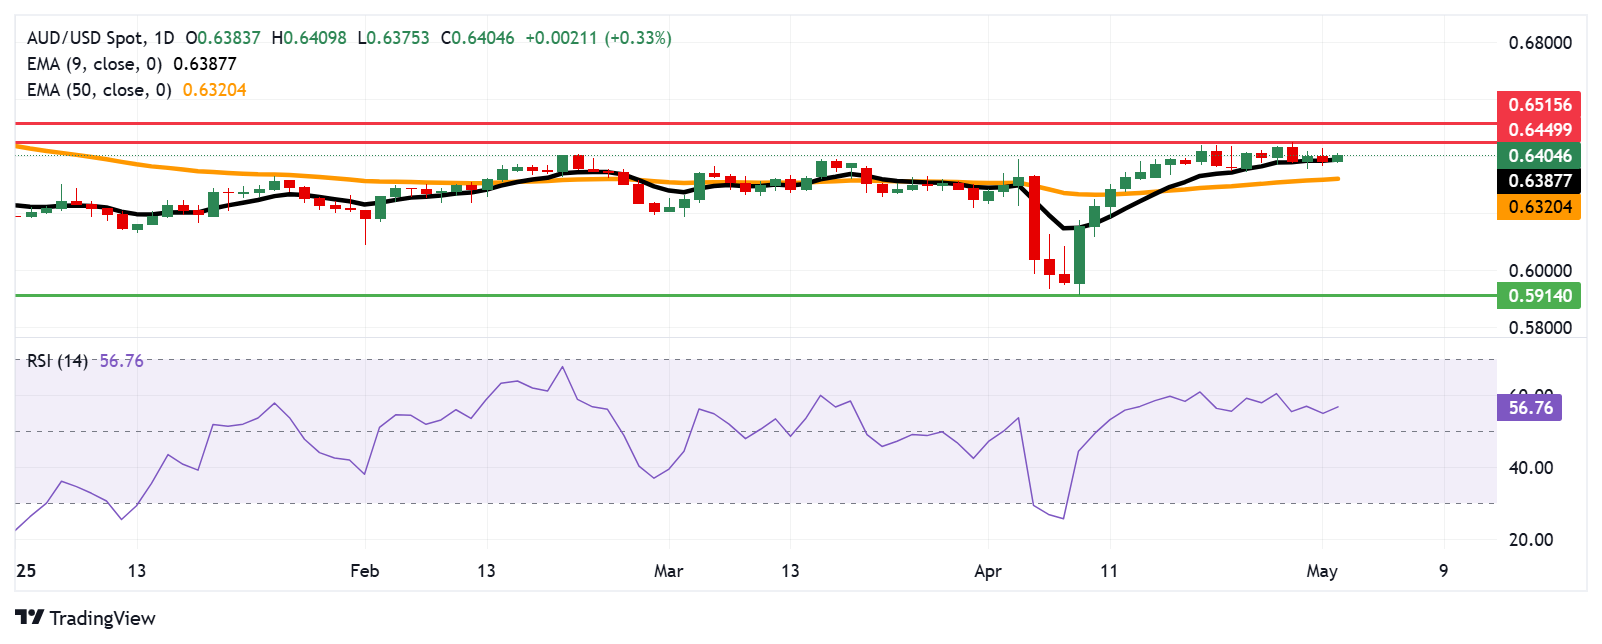
Australian Dollar finds support at 0.6400 near nine-day EMA
The AUD/USD pair is trading around 0.6410 on Friday, maintaining a bullish bias on the daily chart. The pair continues to hold above the nine-day Exponential Moving Average (EMA), while the 14-day Relative Strength Index (RSI) remains comfortably above 50—both suggesting sustained upward momentum.
The AUD/USD pair could find immediate resistance at the recent four-month high of 0.6449, posted on April 29. A decisive break above this level could pave the way toward the five-month high at 0.6515.
On the downside, initial support is located at the nine-day EMA at 0.6387, followed by the 50-day EMA at 0.6320. A breach below these levels could weaken the bullish outlook and may expose the pair to deeper losses, with the March 2020 low near 0.5914 as a distant bearish target.
AUD/USD: Daily Chart
Australian Dollar PRICE Today
The table below shows the percentage change of Australian Dollar (AUD) against listed major currencies today. Australian Dollar was the strongest against the Swiss Franc.
| USD | EUR | GBP | JPY | CAD | AUD | NZD | CHF | |
|---|---|---|---|---|---|---|---|---|
| USD | 0.10% | -0.00% | 0.19% | -0.09% | -0.29% | -0.24% | 0.21% | |
| EUR | -0.10% | -0.09% | 0.12% | -0.18% | -0.38% | -0.31% | 0.12% | |
| GBP | 0.00% | 0.09% | 0.17% | -0.07% | -0.28% | -0.21% | 0.22% | |
| JPY | -0.19% | -0.12% | -0.17% | -0.28% | -0.47% | -0.42% | 0.05% | |
| CAD | 0.09% | 0.18% | 0.07% | 0.28% | -0.21% | -0.13% | 0.31% | |
| AUD | 0.29% | 0.38% | 0.28% | 0.47% | 0.21% | 0.07% | 0.51% | |
| NZD | 0.24% | 0.31% | 0.21% | 0.42% | 0.13% | -0.07% | 0.43% | |
| CHF | -0.21% | -0.12% | -0.22% | -0.05% | -0.31% | -0.51% | -0.43% |
The heat map shows percentage changes of major currencies against each other. The base currency is picked from the left column, while the quote currency is picked from the top row. For example, if you pick the Australian Dollar from the left column and move along the horizontal line to the US Dollar, the percentage change displayed in the box will represent AUD (base)/USD (quote).
Economic Indicator
Retail Sales s.a. (MoM)
The Retail Sales data, released by the Australian Bureau of Statistics on a monthly basis, measures the value of goods sold by retailers in Australia. Changes in Retail Sales are widely followed as an indicator of consumer spending. Percent changes reflect the rate of changes in such sales, with the MoM reading comparing sales values in the reference month with the previous month. Generally, a high reading is seen as bullish for the Australian Dollar (AUD), while a low reading is seen as bearish.
Read more.Last release: Fri May 02, 2025 01:30
Frequency: Monthly
Actual: 0.3%
Consensus: 0.4%
Previous: 0.2%
Source: Australian Bureau of Statistics
The primary gauge of Australia’s consumer spending, the Retail Sales, is released by the Australian Bureau of Statistics (ABS) about 35 days after the month ends. It accounts for approximately 80% of total retail turnover in the country and, therefore, has a significant bearing on inflation and GDP. This leading indicator has a direct correlation with inflation and the growth prospects, impacting the Reserve Bank of Australia’s (RBA) interest rates decision and AUD valuation. The stats bureau uses the forward factor method, ensuring that the seasonal factors are not distorted by COVID-19 impacts.
Artigos Recomendados


