
Crypto Today: Bitcoin, Ethereum, XRP showcase bullish signals after US-EU trade deal
- Bitcoin renews bid for record highs, approaches $120,000 after the US-EU tariff deal.
- Ethereum steals the spotlight, attracting nearly $1.6 billion in inflows last week while edging closer to $4,000.
- XRP shows signs of regaining bullish momentum toward its record high of $3.66.
Bitcoin (BTC) price holds slightly below $119,000 on Monday, after making a swift recovery following the sell-off to $114,728 on Friday. Leading altcoins, including Ethereum (ETH) and Ripple (XRP), showcase bullish signs amid steady market sentiment, which was reaffirmed by the trade deal between the United States (US) and the European Union (EU) on Sunday.
Market overview: US-EU trade deal bolsters the crypto market
US President Donald Trump announced a trade deal with the EU on Sunday, which will see the bloc face 15% tariffs on most of its exports, including automobiles. The trade pact, which comes less than a week before President Trump’s higher tariffs take effect on August 1, has been lauded by European leaders as being sustainable.
Trump called it “the biggest of all the deals,” while the European Commission President Ursula von der Leyen said that it would usher in “stability” and “predictability,” according to Bloomberg.
In addition to the tariff agreement, the EU agreed to purchase $750 billion of American energy products, invest an additional $600 billion in the US beyond existing expenditures, and open up the countries in the bloc to trade with the US at zero tariffs. The EU also agreed to purchase a significant amount of US military equipment.
Cryptocurrency prices steadied following the announcement of the deal, with traders appearing confident enough to increase their exposure. Bitcoin is edging toward $120,000, Ethereum is approaching the $4,000 mark, while XRP steadies recovery, targeting its record high of $3.66.
Data spotlight: Ethereum dominates fund inflows
Digital asset investment products recorded total inflows of $1.9 billion last week, according to a CoinShares report. Ethereum dominated capital inflows with $1.59 billion, its second-largest week in history.
“Ethereum stood out, unusually leading with US$1.59bn in inflows last week, its second-strongest week on record. Year-to-date inflows into Ethereum have now reached US$7.79bn, surpassing the total for all of last year,” the CoinShares report highlighted.
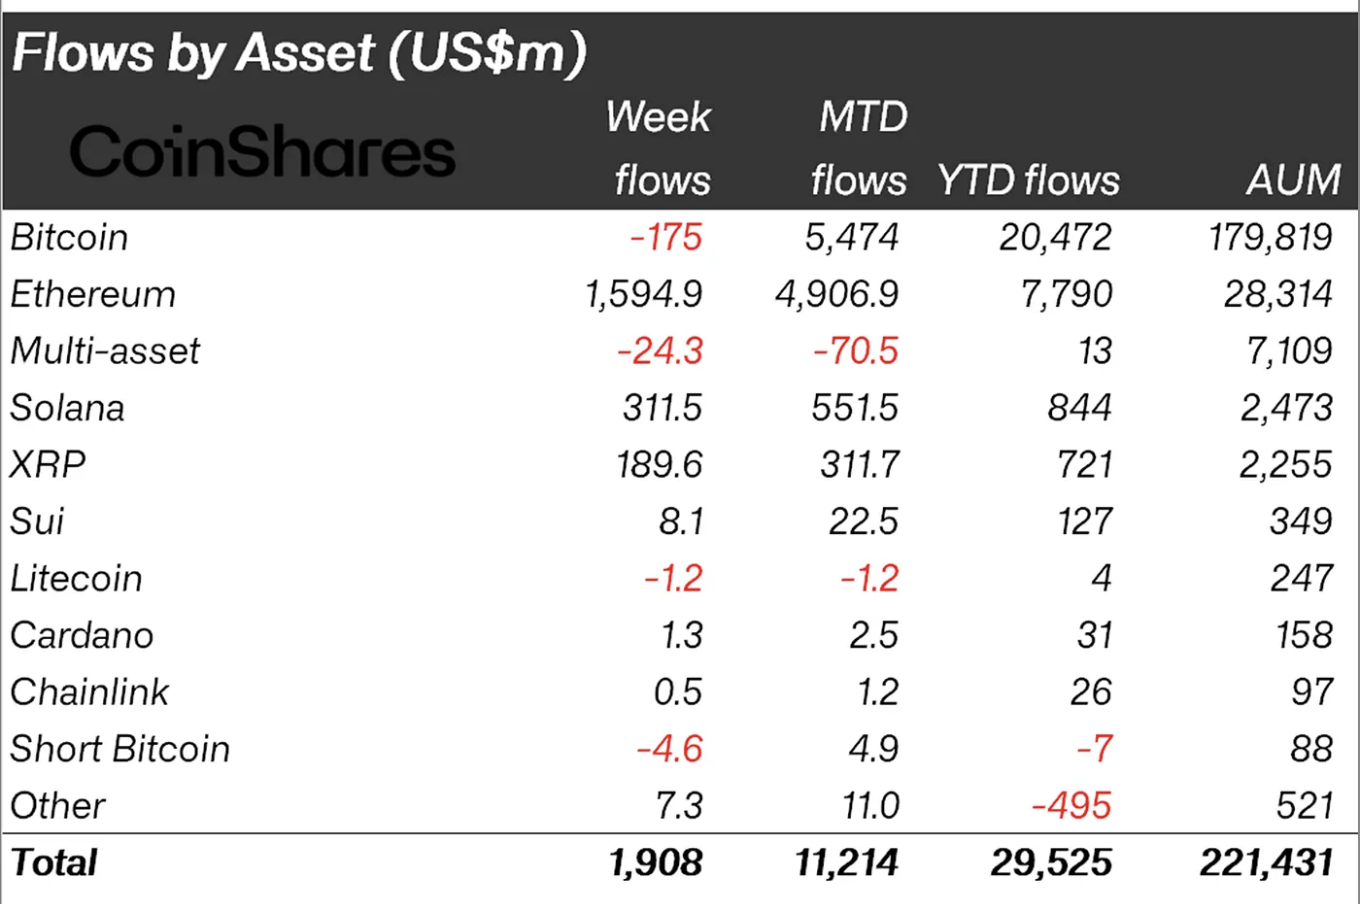
Digital asset investment products data | Source: CoinShares
Bitcoin experienced minor outflows, amounting to $175 million, creating a notable divergence from trends in the altcoin market. For instance, Solana (SOL) and XRP attracted significant inflows of $311 million and $189 million, respectively, raising the question of whether this marks the beginning of the altcoin season.
“These altcoin inflows may be driven less by broad-based enthusiasm and more by anticipation surrounding potential US Exchange Traded Funds (ETF) launches,” the CoinShares report added.
Chart of the day: Bitcoin uptrend could take a breather
Bitcoin price faces a sudden surge of bearish headwinds as it slides to trade at around $118,704 at the time of writing on Monday. This minor intraday pullback follows an upswing to $119,800 bolstered by risk-on sentiment surrounding the US-EU trade deal.
A recently broken descending trendline is poised to absorb the selling pressure. Still, if the decline accelerates, traders should consider shifting their focus to the 50-period Exponential Moving Average (EMA) at $118,048 on the 4-hour chart. The 100-period EMA at $116,978 and the 200-day EMA at $114,280 could also prevent the down leg from extending toward support at $110,504, tested on July 10.
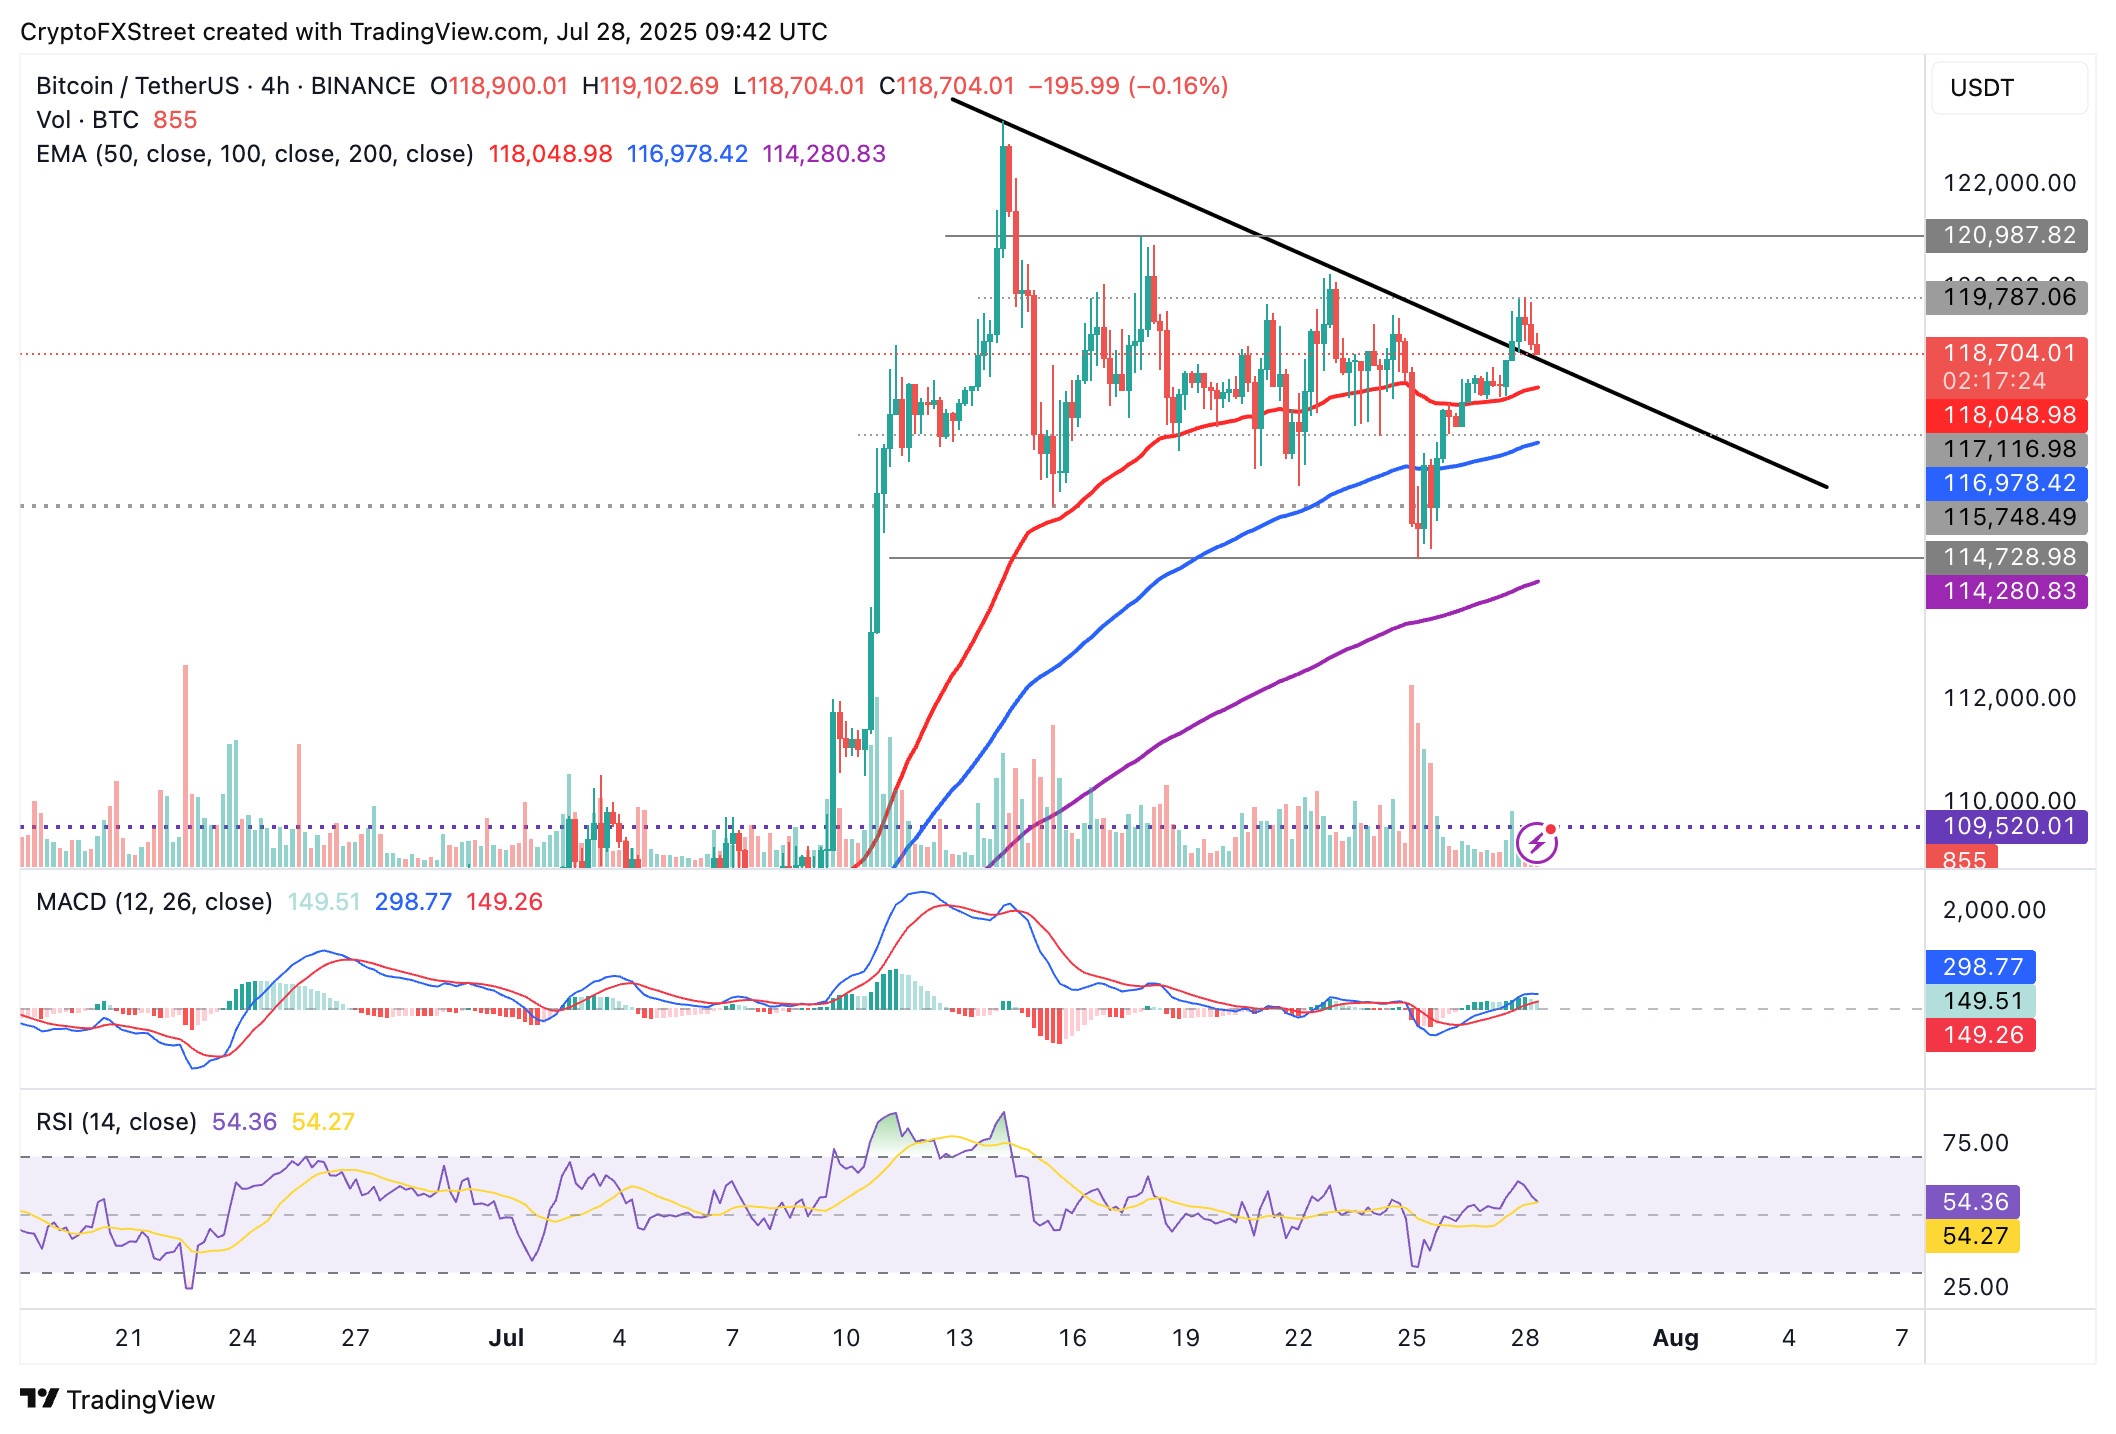
BTC/USDT 4-hour chart
Still, traders should temper their bearish expectations, considering that the Moving Average Convergence Divergence (MACD) indicator has upheld a buy signal, triggered on Saturday when the blue line crossed above the red signal line. This is a bullish signal that often prompts investors to increase their exposure, thereby boosting bullish momentum.
Altcoins update: Ethereum, XRP bulls tighten grip
Ethereum price has upheld the uptrend following a brief pullback to $3,500, the support level it tested last week. The smart contracts token has, over the last few weeks, stabilized its uptrend, backed by both institutional and retail interest.
While Bitcoin funds experienced outflows last week, Ethereum investment products saw an influx of nearly $1.6 billion in inflow volume. This underscores the shift in investor confidence, which is reflected in the rising demand and steady price increase.
Despite overheated market conditions, with the Relative Strength Index (RSI) holding at 82, the Ethereum price appears ready to flip the $4,000 resistance into support. Its bullish structure is supported by a buy signal from the MACD indicator and robust support levels, including $3,500, which was tested on Friday, and the 50-day EMA at $3,035.
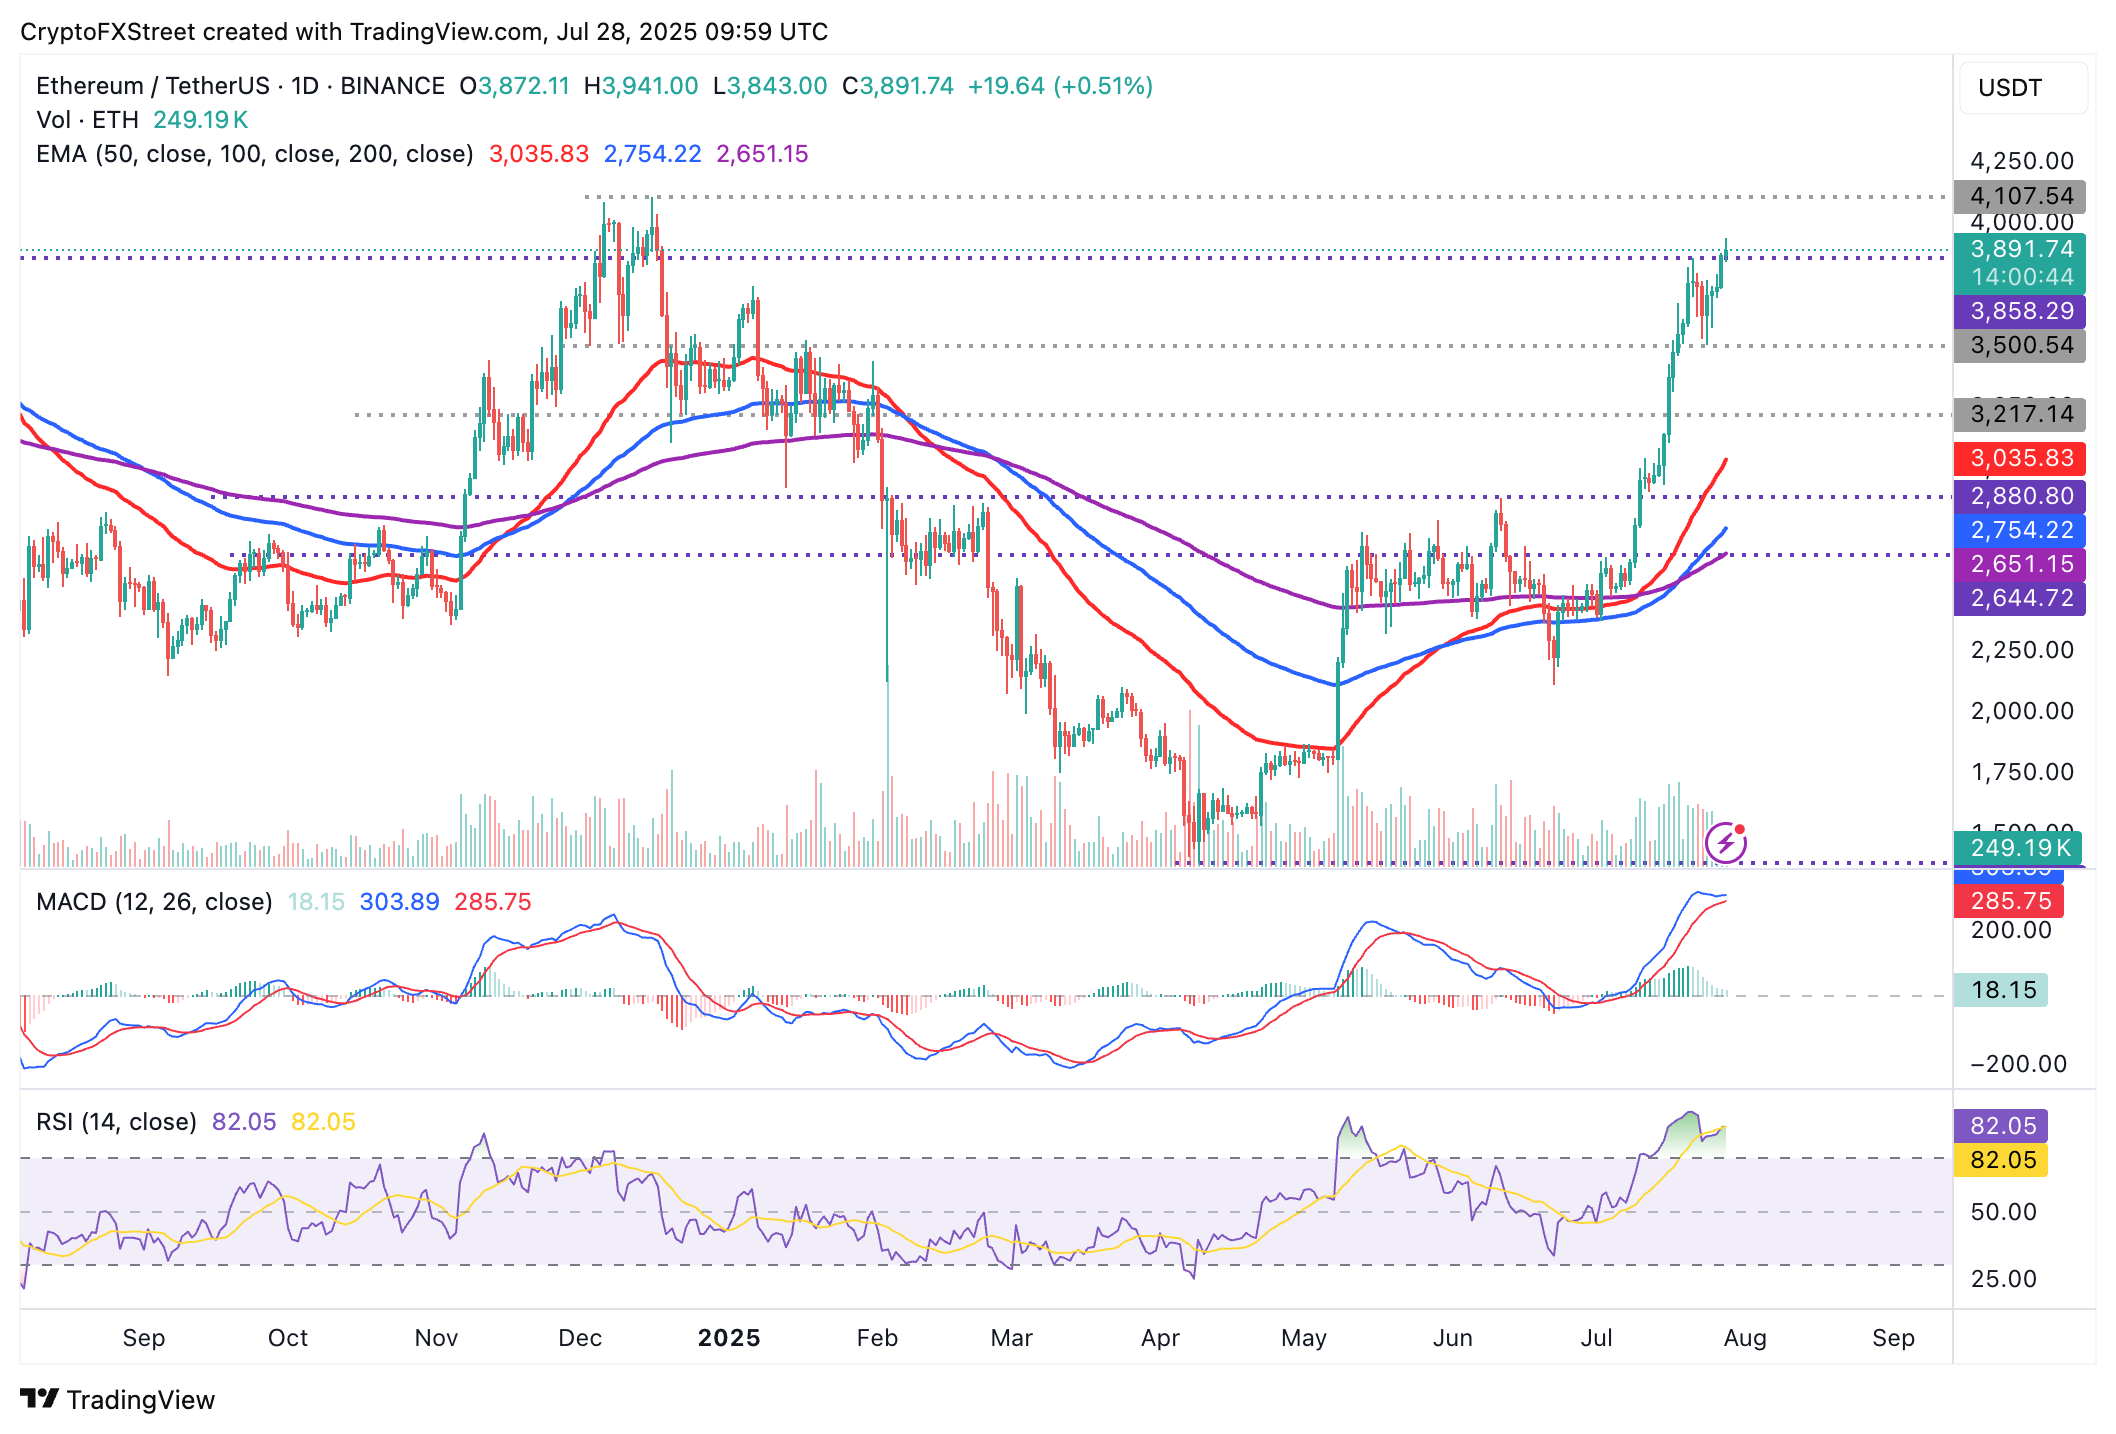
ETH/USDT daily chart
As for XRP, bulls have regained control of the trend, accelerating the recovery by over 10% from the support level tested at $2.95 on Thursday. With the RSI remaining in the bullish region but not overbought at 64, there’s room for extending the recovery toward the all-time high of $3.66.
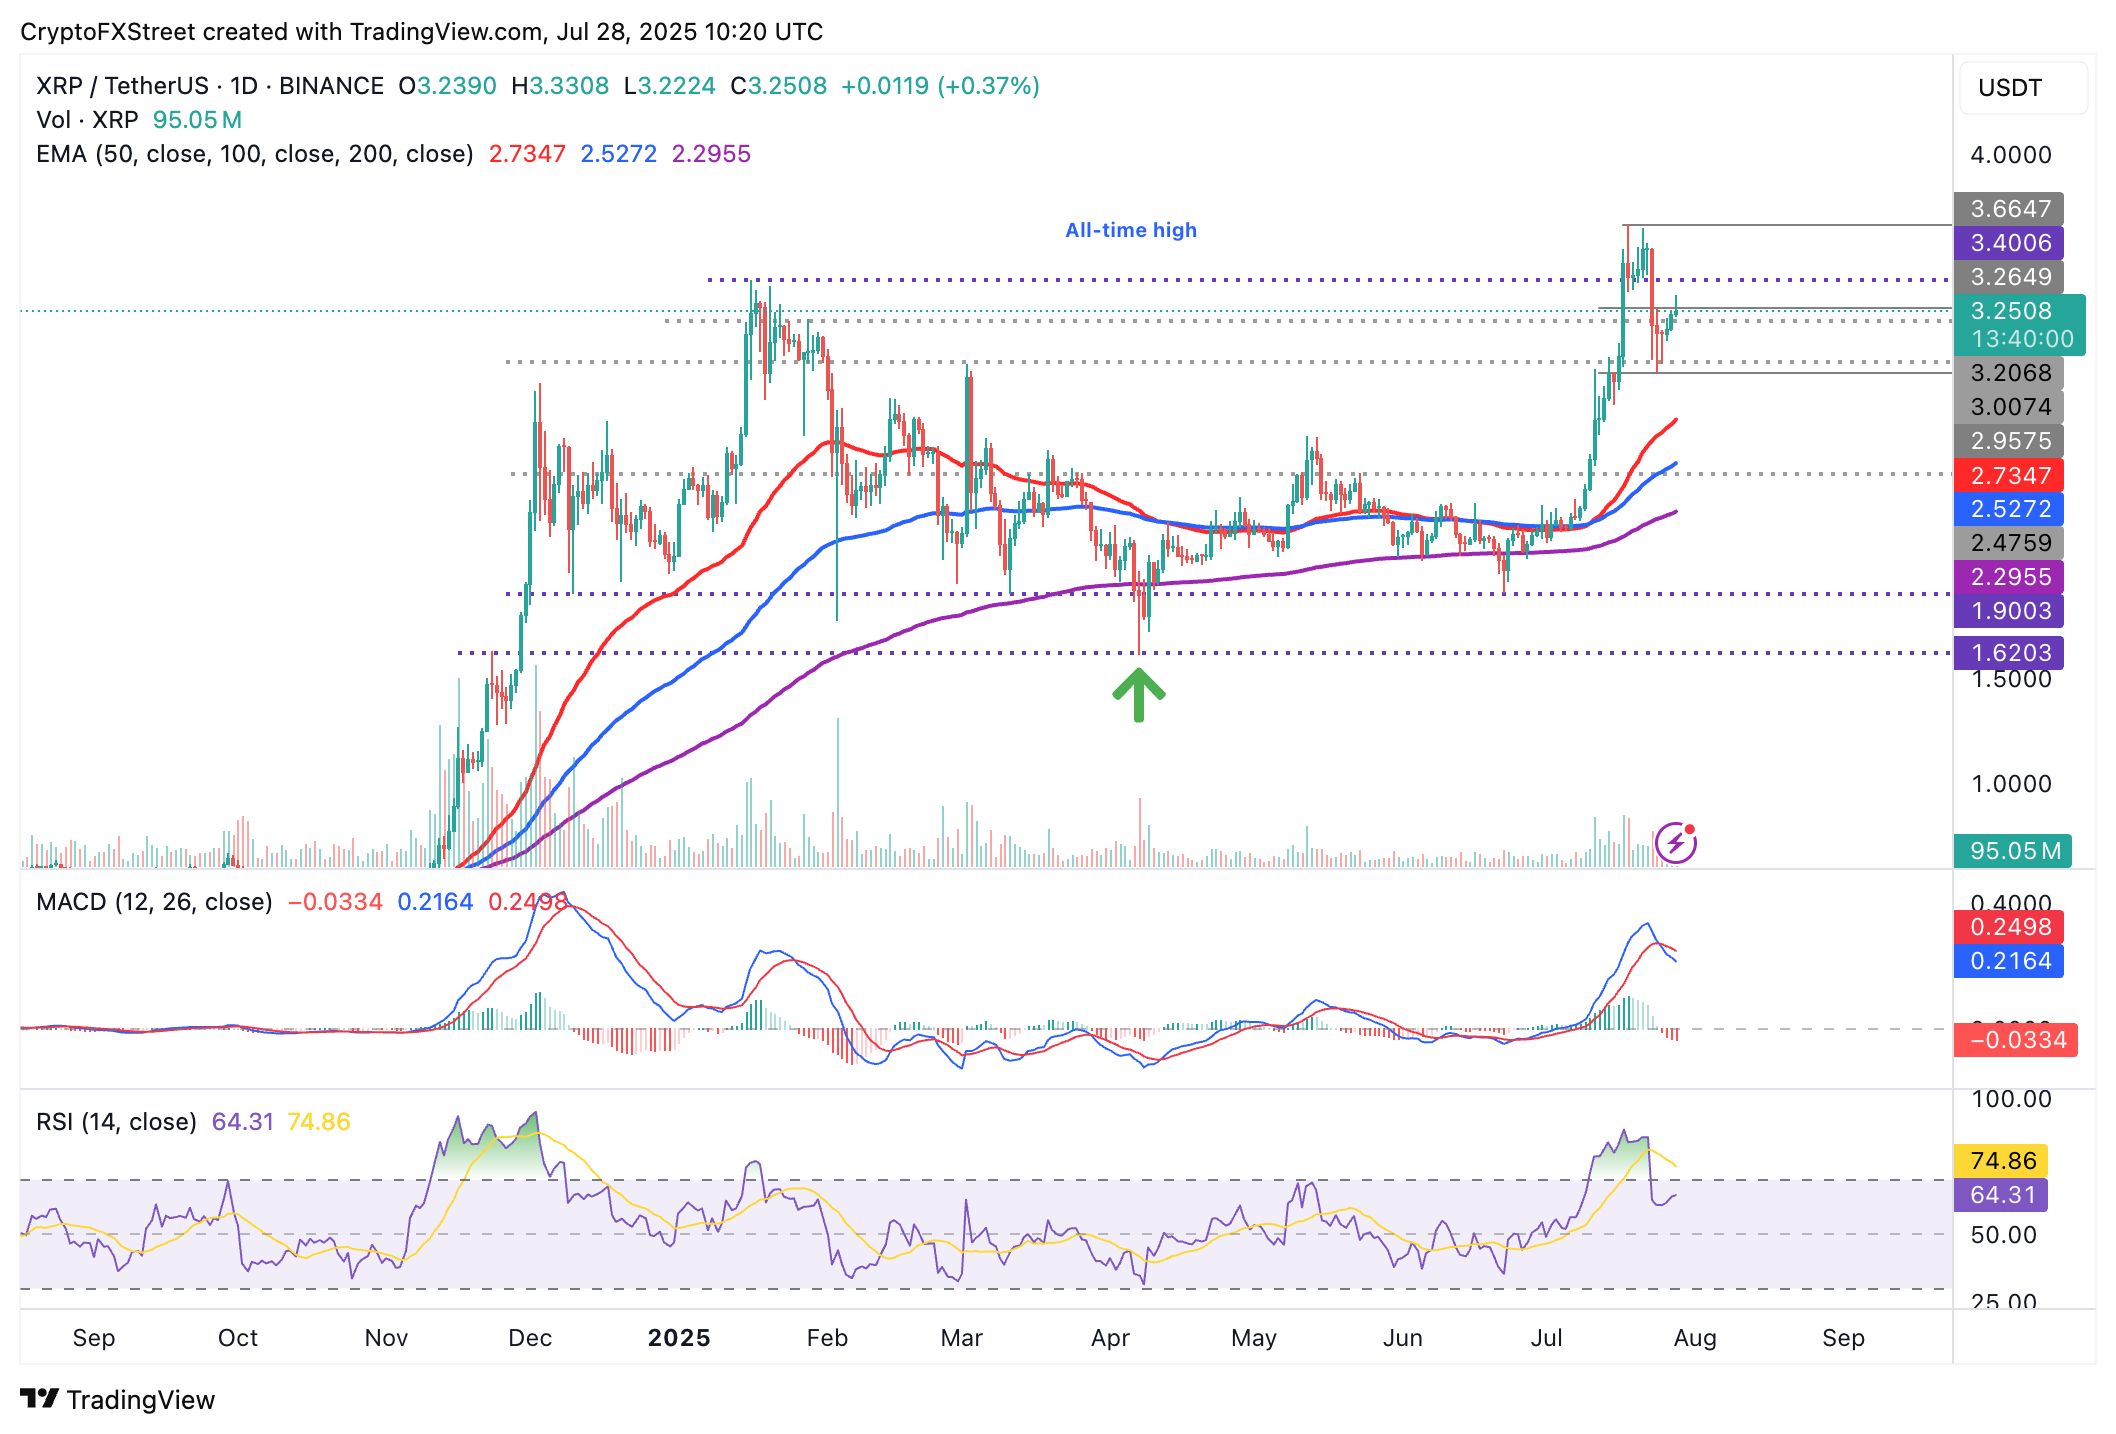
XRP/USDT daily chart
Traders should monitor potential resistance at $3.40, the previous record high reached on January 16. A breach of this level could affirm the bullish grip, but a reversal cannot be ruled out, especially with the MACD indicator upholding a sell signal, triggered on Friday.
Bitcoin, altcoins, stablecoins FAQs
Bitcoin is the largest cryptocurrency by market capitalization, a virtual currency designed to serve as money. This form of payment cannot be controlled by any one person, group, or entity, which eliminates the need for third-party participation during financial transactions.
Altcoins are any cryptocurrency apart from Bitcoin, but some also regard Ethereum as a non-altcoin because it is from these two cryptocurrencies that forking happens. If this is true, then Litecoin is the first altcoin, forked from the Bitcoin protocol and, therefore, an “improved” version of it.
Stablecoins are cryptocurrencies designed to have a stable price, with their value backed by a reserve of the asset it represents. To achieve this, the value of any one stablecoin is pegged to a commodity or financial instrument, such as the US Dollar (USD), with its supply regulated by an algorithm or demand. The main goal of stablecoins is to provide an on/off-ramp for investors willing to trade and invest in cryptocurrencies. Stablecoins also allow investors to store value since cryptocurrencies, in general, are subject to volatility.
Bitcoin dominance is the ratio of Bitcoin's market capitalization to the total market capitalization of all cryptocurrencies combined. It provides a clear picture of Bitcoin’s interest among investors. A high BTC dominance typically happens before and during a bull run, in which investors resort to investing in relatively stable and high market capitalization cryptocurrency like Bitcoin. A drop in BTC dominance usually means that investors are moving their capital and/or profits to altcoins in a quest for higher returns, which usually triggers an explosion of altcoin rallies.
Artigos Recomendados


