
Crypto Today: Bitcoin defies pullback risks after Strategy purchase
- Bitcoin steadies the uptrend, approaching $110,000 immediate resistance, fueled by strong institutional interest.
- Strategy announced the purchase of around 4,000 BTC, bringing total holdings to 580,250 BTC.
- Despite Bitcoin’s price rally to new all-time highs, spot trading volumes remain subdued, highlighting caution among market participants.
- Ethereum rises while Solana consolidates, signaling trader indecision.
The cryptocurrency market upholds a bullish outlook even as prices widely consolidate on Tuesday. Bitcoin’s (BTC) sharp slump from the all-time highs of $111,980, driven by concerns about the United States (US) tariff policy with the European Union (EU), was taken as an opportunity for institutions like Strategy, formerly MicroStrategy, to scoop more BTC.
Market overview: Assessing US tariff policy impact on cryptocurrencies
Global markets saw relief on Monday following the announcement by US President Donald Trump that the 50% tariff threat on the EU has been suspended until July 9. This came after a call with EU President Ursula von der Leyen on Sunday, paving the way for further negotiation between the US and the bloc.
Select altcoins like Ethereum (ETH) are extending gains on Tuesday alongside Bitcoin, signaling solid sentiment among investors, especially institutional ones. Ethereum-related financial products recorded over $326 million in inflow volume last week, according to CoinShares weekly report.
Meanwhile, Solana (SOL) has been moving broadly sideways in the past five days between support at around $163 and resistance at approximately $185. Top meme coins like Dogecoin (DOGE) and Shiba Inu (SHIB) are also consolidating.
QCP Capital said in a note via its Telegram channel that “risk sentiment remains in flux after a steady climb in risk assets since April and with S&P 500 edging toward the symbolic 6,000 mark and amid declining volatility.
Market watchers have set their sights on Friday’s US Personal Consumption Expenditure (PCE) Price Index, an important gauge for the Federal Reserve’s (Fed) upcoming policy decision on June 18.
Data spotlight: Strategy buys 4,000 BTC, steadying institutional interest
Bitcoin’s reaction to the macroeconomic events of last week, including fresh tariff tensions and the sticky Russian-Ukraine war, was relatively short-lived, followed by buy-the-dip campaigns. CoinShares digital assets inflow report highlighted growing institutional demand.
Bitcoin-related products boasted over $2.9 billion in inflows led by spot Exchange Traded Funds (ETFs). The King of the crypto market steadied the uptrend, briefly reaching highs slightly above $110,000 on Monday before settling slightly below the same pivotal level.
Strategy, the largest corporate holder of Bitcoin, announced the acquisition of 4,020 BTC at an average purchase price of $427.1 million on Monday. The acquisition saw Strategy’s total BTC holdings climb to 580,250 at an aggregate purchase price of $40.61 billion and approximately $69,979 per BTC.
Bitcoin’s price continues to trade close to its all-time highs despite the resistance at $110,000. The elevated price is supported by strong institutional interest and macroeconomic uncertainty, especially in the US, after Moody’s and the International Monetary Fund (IMF) sounded alarms on the country’s debt sustainability. Investors seem to be flocking to Bitcoin to hedge the rise in Treasury yields.
“The sustained elevation in the near-term volumes suggests that traders are positioned around headline risk ahead of the Bitcoin Conference in Las Vegas, scheduled for Tuesday and Wednesday,” QCP researchers said via a Telegram note.
Chart of the day: Can Bitcoin strengthen its uptrend to ATH?
Bitcoin’s price hovers at $109,868 as bulls strive to break short-term resistance at $110,000. The Relative Strength Index (RSI) on the daily chart below holds at 67, after sliding from the overbought region above 70.
A break above $110,000 would encourage traders to bet on a further increase in BTC price, accelerating the RSI back into the overbought area.
However, the position of the Moving Average Convergence Divergence (MACD) indicator highlights overhanging risks of a longer trend reversal, especially with the blue MACD line hovering below the red signal line. The MACD could drop toward the mean line before Bitcoin regains strength to tag its all-time high and potentially extend the price discovery phase toward $115,000.
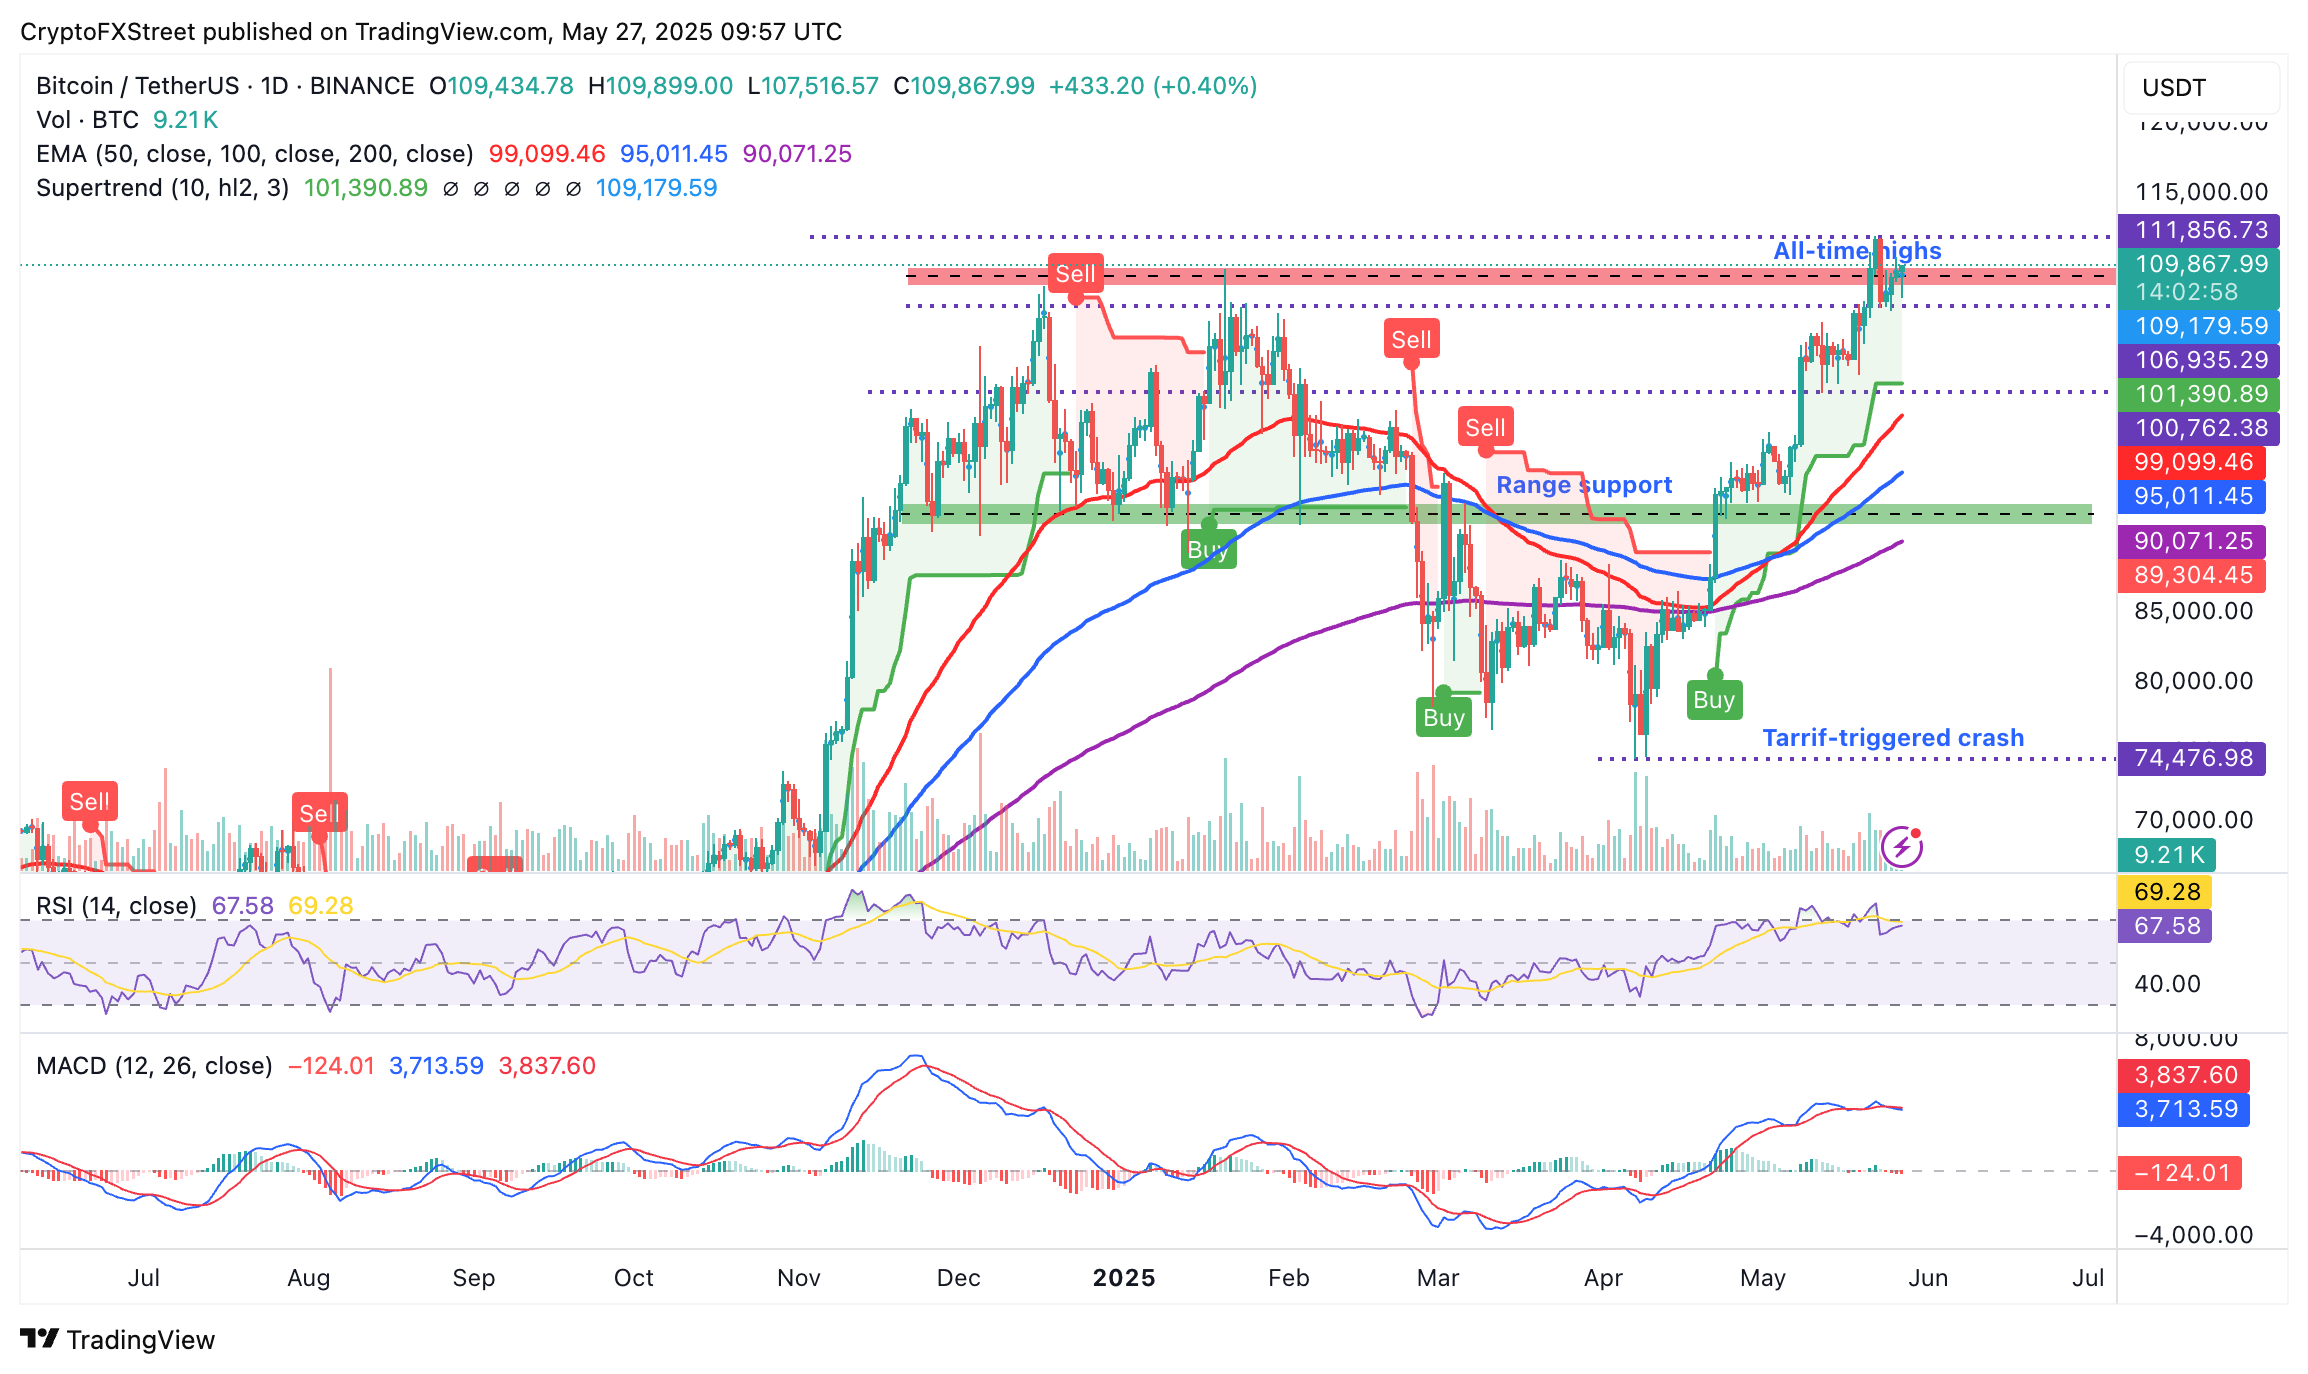
BTC/USDT daily chart
Key areas of interest on the downside include the demand area at around $106,953, tested over the weekend, and the SuperTrend indicator, acting as dynamic support at around $101,390.
Altcoin performance: Ethereum regains bullish momentum
The largest altcoin by market capitalization, Ethereum, is steadily rising its uptrend, rising almost 3% on the day to exchange hands at $2,638. ETH sits on top of key moving averages, including the 50-day Exponential Moving Average (EMA) at $2,229, signaling a potential crossover above the 100-day EMA at $2,254.
The 200-day EMA at $2,449 offers immediate support, increasing the probability of the uptrend breaking the next resistance at $2,740 if it holds and subsequently returning above the coveted $3,000 level.
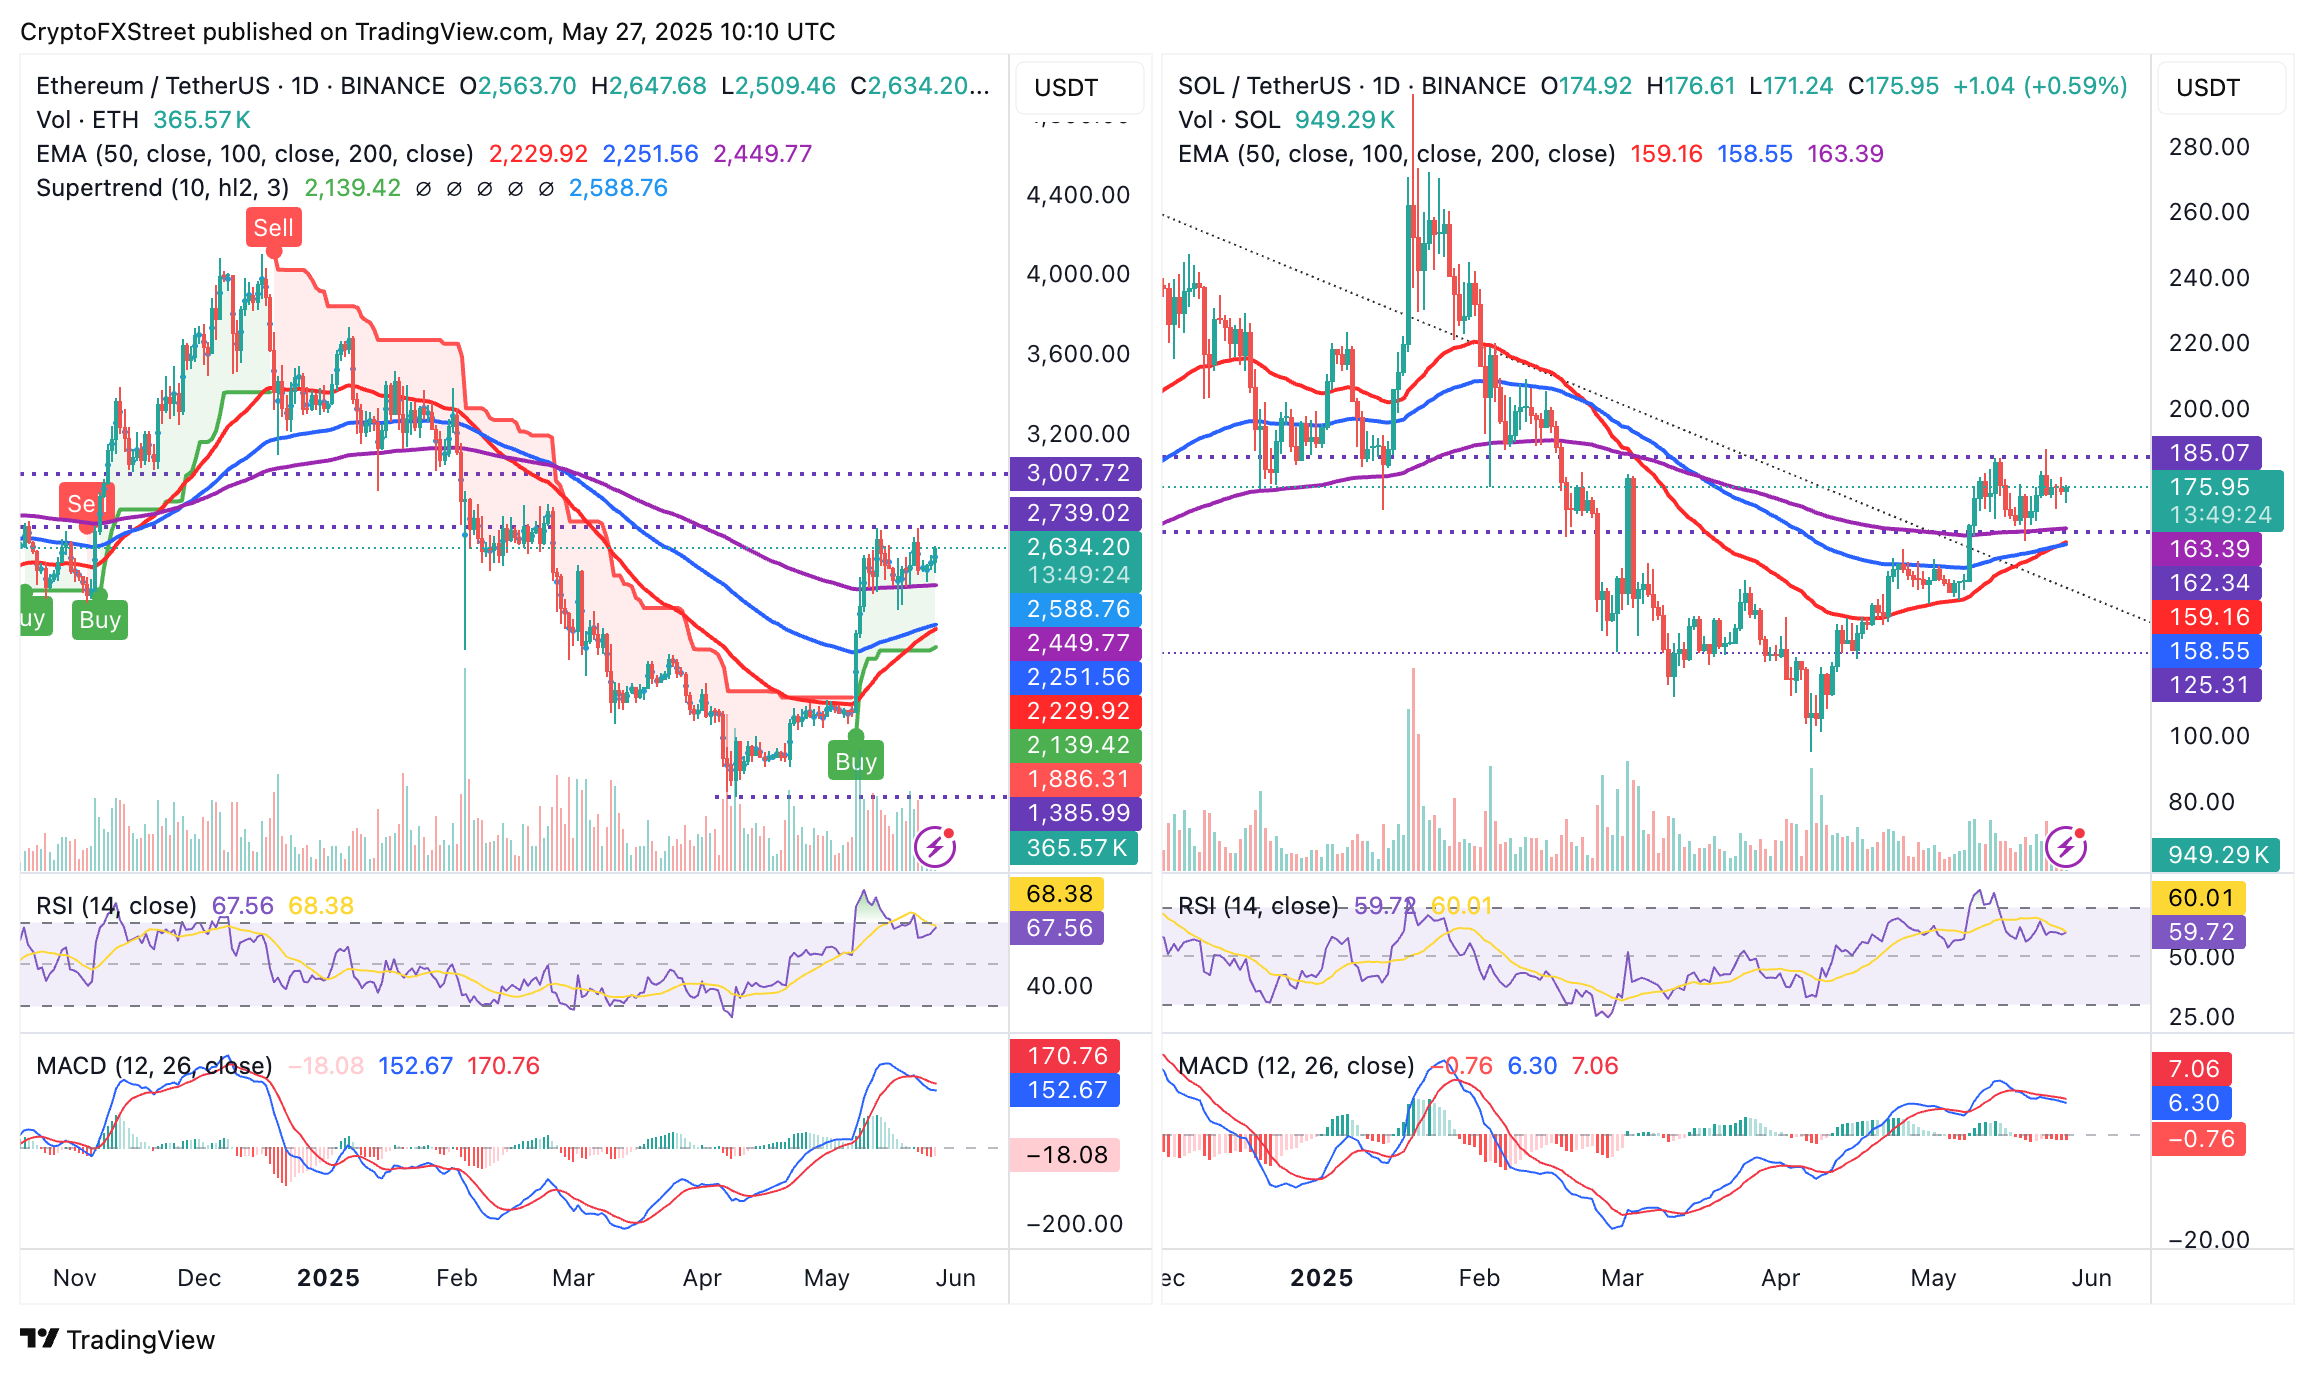
ETH/USD and SOL/USD daily charts
As for Solana, the token consolidates in a narrow range between support provided by the 200-day EMA at $163 and the immediate resistance at $185. The path with the least resistance shifts downwards as the MACD indicator slides towards the center line after validating a sell signal May 18. This indicator, flashes a sell signal when the blue MACD line crosses below the red signal line, potentially encourging traders to sell SOL.
Beyond the 200-day EMA at $163, the next area of interest for traders wishing to buy the dip includes the confluence at $158, combining the 100-day EMA and the 50-day EMA. Accelerated losses could sweep through liquidity at $125, an area last tested as support in mid-April.
Cryptocurrency prices FAQs
Token launches influence demand and adoption among market participants. Listings on crypto exchanges deepen the liquidity for an asset and add new participants to an asset’s network. This is typically bullish for a digital asset.
A hack is an event in which an attacker captures a large volume of the asset from a DeFi bridge or hot wallet of an exchange or any other crypto platform via exploits, bugs or other methods. The exploiter then transfers these tokens out of the exchange platforms to ultimately sell or swap the assets for other cryptocurrencies or stablecoins. Such events often involve an en masse panic triggering a sell-off in the affected assets.
Macroeconomic events like the US Federal Reserve’s decision on interest rates influence crypto assets mainly through the direct impact they have on the US Dollar. An increase in interest rate typically negatively influences Bitcoin and altcoin prices, and vice versa. If the US Dollar index declines, risk assets and associated leverage for trading gets cheaper, in turn driving crypto prices higher.
Halvings are typically considered bullish events as they slash the block reward in half for miners, constricting the supply of the asset. At consistent demand if the supply reduces, the asset’s price climbs.
Artigos Recomendados


