
Hyperliquid stays firm near all-time high as on-chain metrics soar, eyes set on $46
- Hyperliquid price stabilizes around $37 on Tuesday after hitting a new all-time high of $39.96 the previous day.
- On-chain data supports the price rally as HYPE’s Open Interest, TVL and stablecoin market capitalization reach record levels.
- The technical outlook suggests HYPE enters price discovery mode, targeting the $46 mark.
Hyperliquid (HYPE), the decentralized perpetual trading platform and Layer 1 blockchain, stabilizes around the $37 mark on Tuesday after hitting a new all-time high of $39.96 the previous day. HYPE’s on-chain data supports the price rally as its Open Interest (OI), Total Value Locked (TVL) and stablecoin market capitalization reach record highs. Meanwhile, the price action points to price discovery mode, targeting the $46 mark.
HYPE on-chain metrics hit record level
Coinglass’ data shows that the futures’ OI in HYPE at exchanges rose from $914 million on May 21 to $1.43 billion on Tuesday, a new all-time high (ATH). An increasing OI represents new or additional money entering the market and new buying, which could fuel the current rally in Hyperliquid’s price.
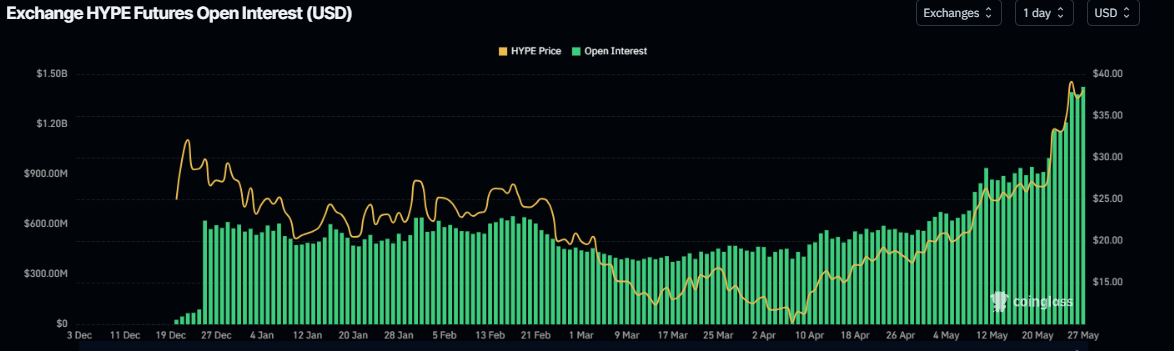
HYPE Open Interest chart. Source: Coinglass
Data from crypto intelligence tracker DefiLlama shows that on Tuesday, HYPE’s TVL increase reached a new ATH of $1.46 billion. This increase in TVL indicates growing activity and interest within the Hyperliquid ecosystem, suggesting that more users are depositing or utilizing assets within HYPE-based protocols.
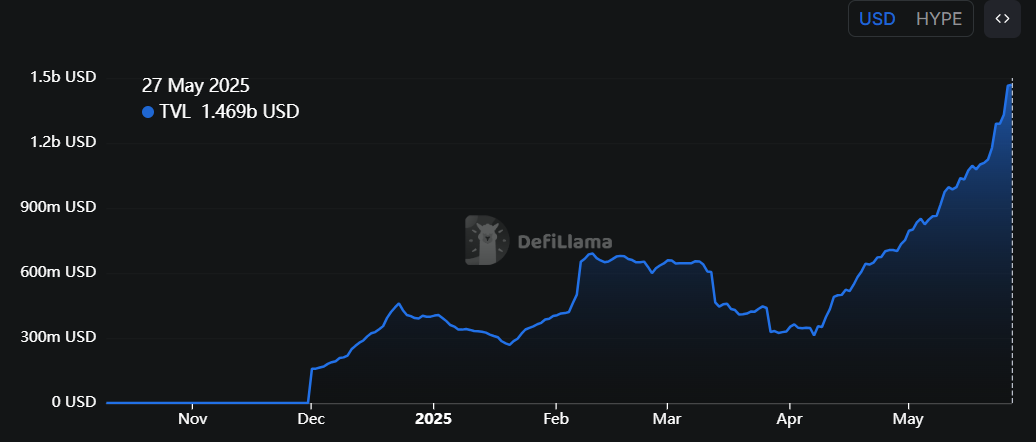
HYPE TVL chart. Source: DefiLlama
According to DefiLlama data, the stablecoin market capitalization currently stands at $3.62 billion. While the volume has retreated somewhat recently, the current stablecoin activity and value increase on HYPE are positive, as they increase network usage and can attract more users to the ecosystem.
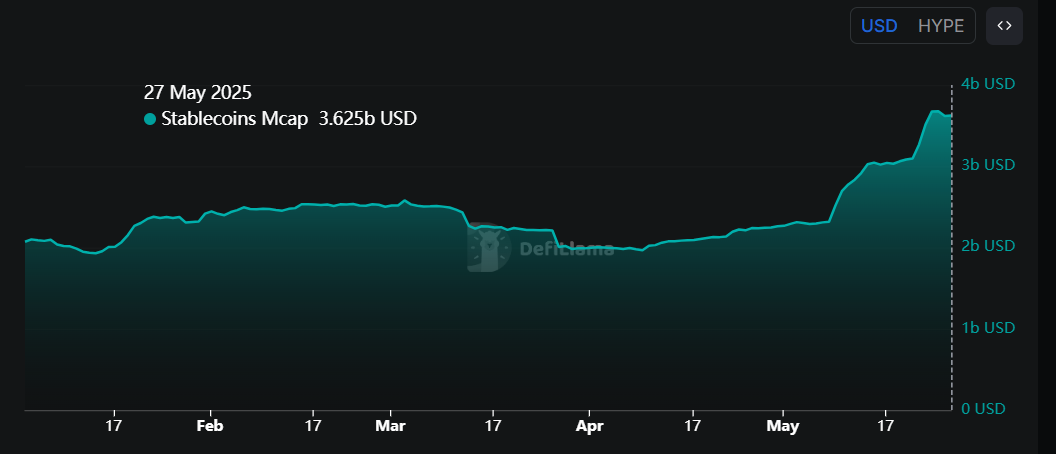
HYPE stablecoin market cap chart. Source: DefiLlama
Hyperliquid Price Forecast: HYPE enters price discovery mode
Hyperliquid reached a new all-time high of $39.96 during the early trading session on Monday but corrected slightly by the end of the day. At the time of writing on Tuesday, HYPE stabilizes at around $37.
If HYPE continues its upward trend, it could extend the rally to $46.35, the 141.40% Fibonacci extension drawn from the December high of $35.51 to the April low of $9.32.
The Relative Strength Index (RSI) on the daily chart reads 77, above its overbought level of 70, indicating strong bullish momentum. However, traders should be cautious as the chances of a pullback are high when overbought levels are reached.
The Moving Average Convergence Divergence (MACD) indicator showed a bullish crossover last week. It also shows rising green histogram bars above the neutral level, suggesting the continuation of an upward trend.
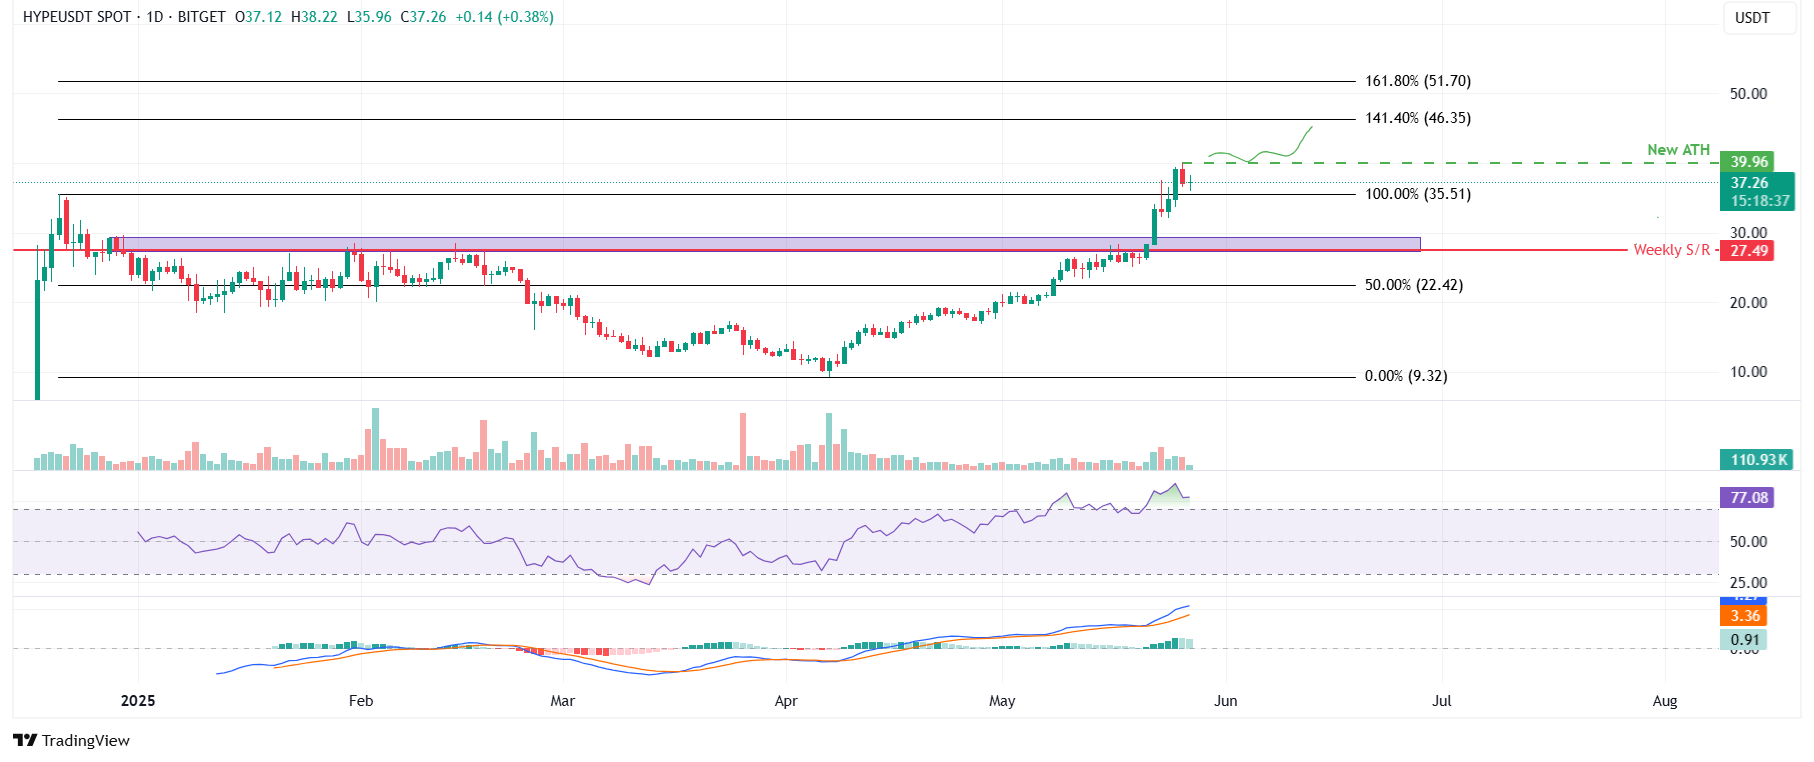
HYPE/USDT daily chart
However, if HYPE faces a correction and closes below $35.51, it could extend the pullback to the key psychologically important level at $30.
Artigos Recomendados


