
Top 3 gainers Fartcoin, Virtuals Protocol, Curve DAO: Altcoins surge as FARTCOIN eyes $2 goal
- Fartcoin steadies recovery above $1.20, bringing the $2.00 goal within reach.
- Virtuals Protocol price soars as golden cross pattern bolsters uptrend momentum.
- Curve DAO breaks out of a cup and handle pattern, supported by increasing trading volume and trader confidence.
The wider cryptocurrency market may have slowed the relief rally that began after United States (US) President Donald Trump paused reciprocal tariffs for 90 days on April 9, but select altcoins such as Fartcoin, Virtuals Protocol (VIRTUAL), Curve DAO (CRV) do not show any signs of a waning bullish momentum. Over the last few weeks, Fartcoin has flipped the bullish trend, riding the wave of Solana-based meme coins' comeback to reach a four-month high of $1.25.
The resurgence of bullish sentiment in the market reflects improving optimism as the US and China ease trade tensions, with expectations of a short-term tariff agreement paving the way for a broader deal.
Fartcoin's bullish outlook prevails
Fartcoin's price hovers at $1.22 at the time of writing on Thursday, amid an extended rally from its April low of $0.35. The meme coin's ascent above the 12-hour 50, 100, and 200 Exponential Moving Averages (EMA) flipped the narrative bullish, igniting trader interest and confidence in the recovery.
Fartcoin's price remains above the key moving averages, indicating a potential long-term bullish trend, which has been recently reinforced by breaking through the critical $1.00 and $1.20 levels.
The SuperTrend indicator presented a buy signal on April 10, which continues to influence Fartcoin's bullish structure. This buy signal occurs when the indicator flips below the token's price, and the color on the chart changes from red to green.
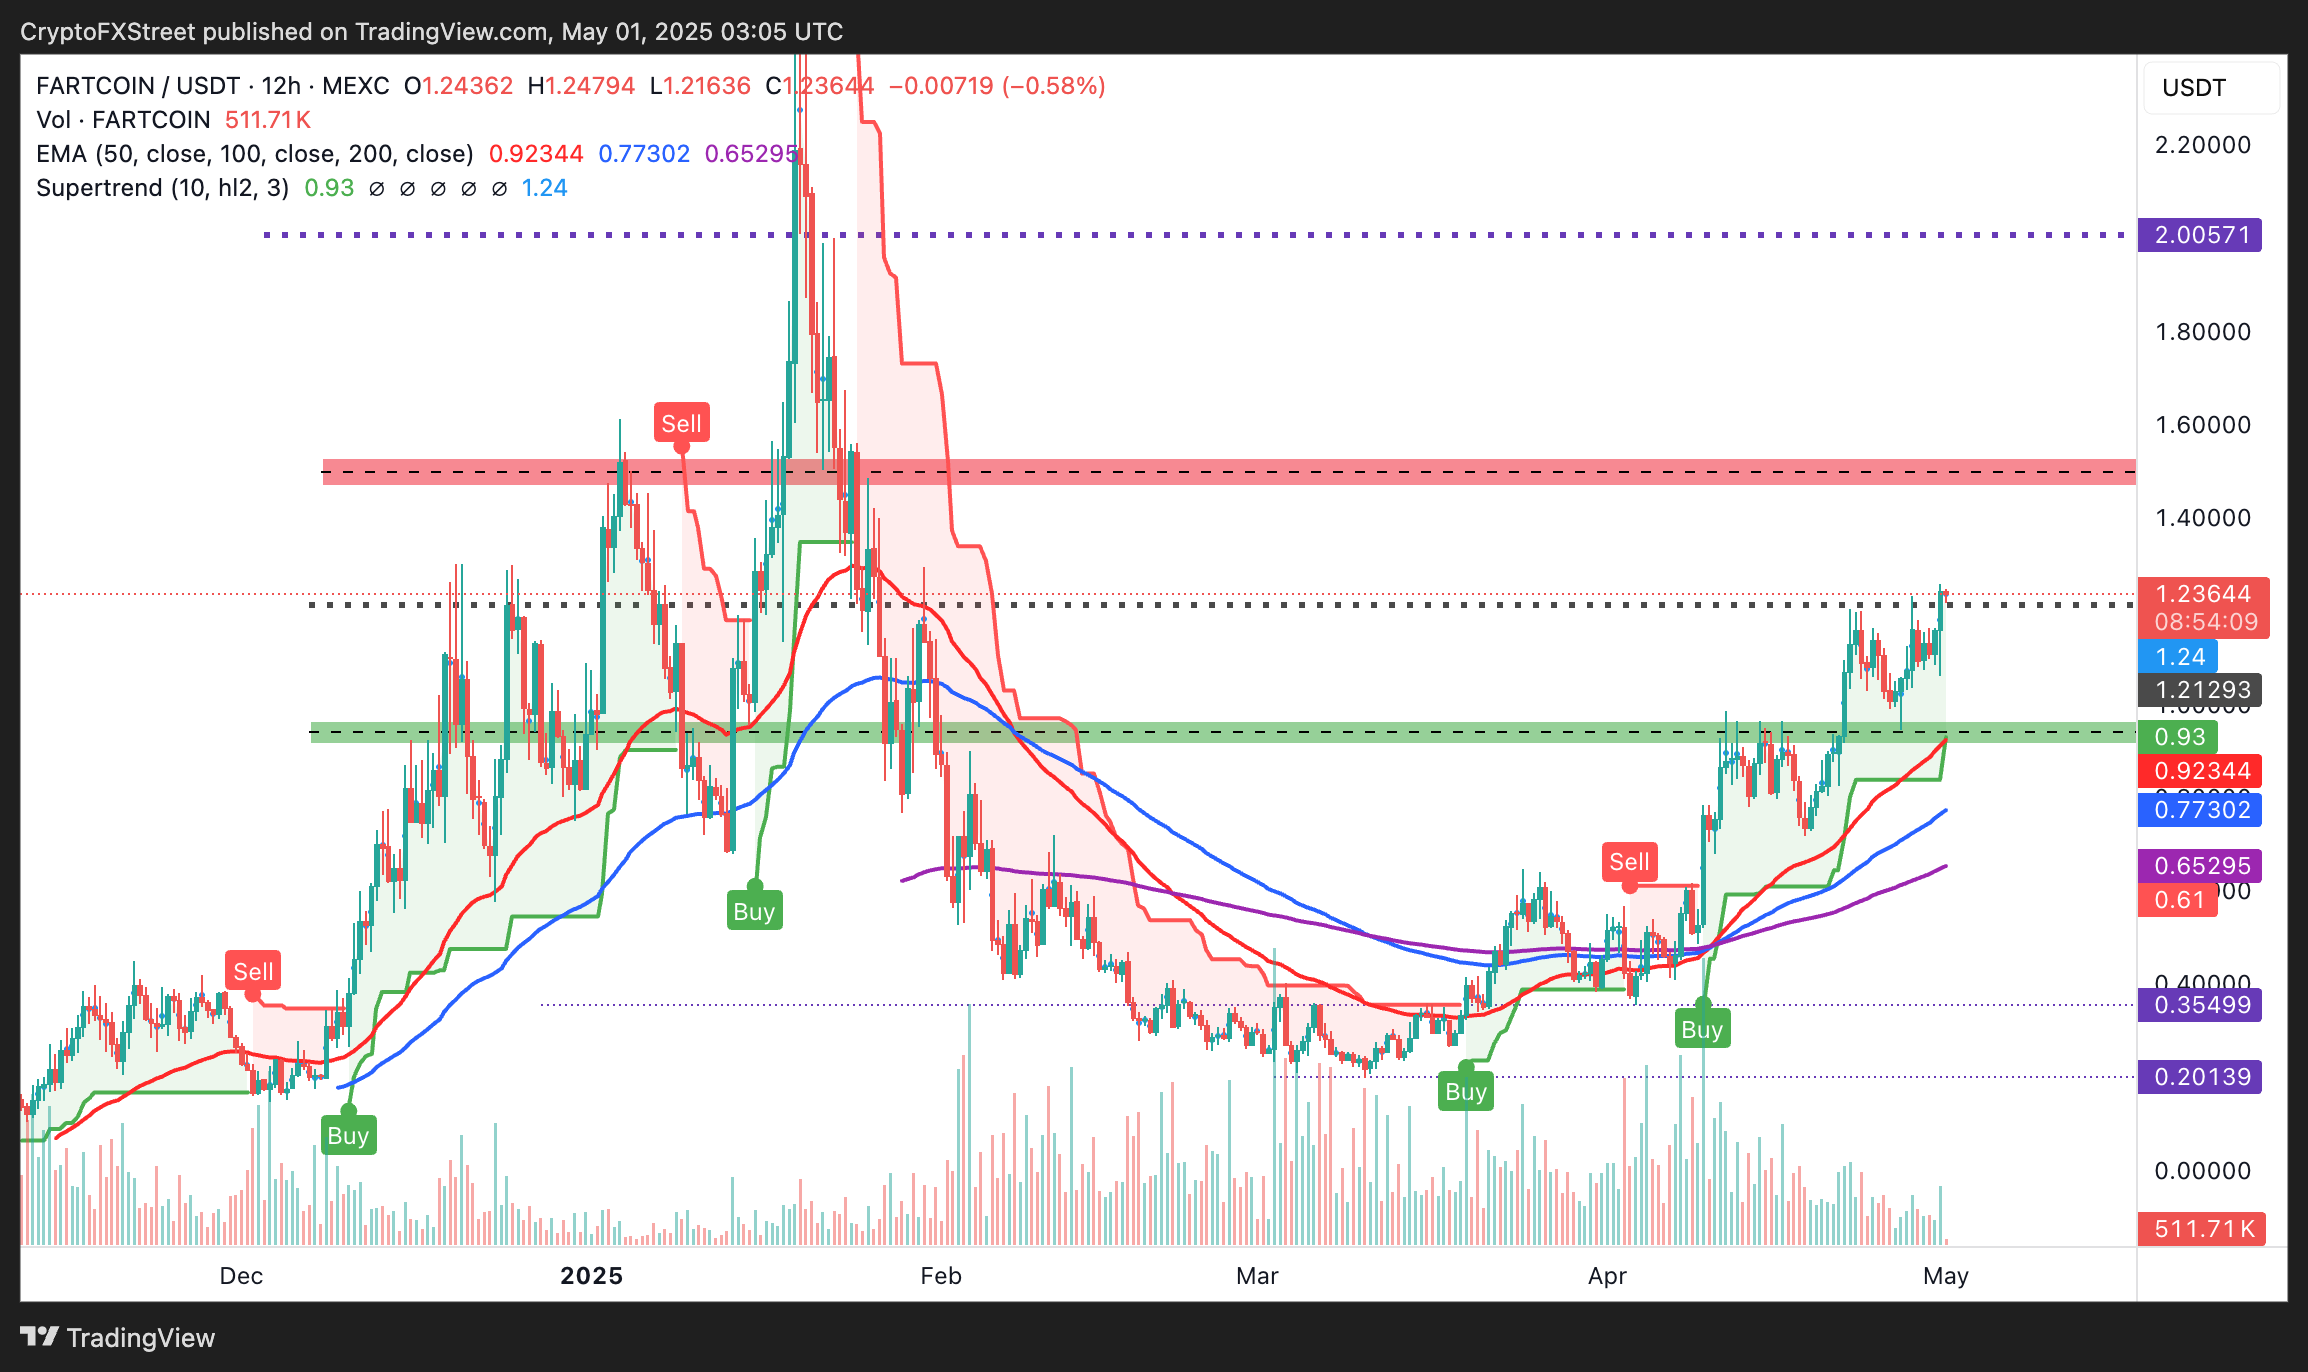
FARTCOIN/USDT 12-hour chart
Traders should watch for confirmed support above the former resistance, now acting as support at $1.20, to gauge the strength of the uptrend. On the upside, supply zones at $1.50 and $1.80 are key to monitor as Fartcoin aims for its $2.00 target. However, profit-taking at these levels might hinder the uptrend or trigger a reversal.
Virtuals Protocol bulls maintain strong momentum
Virtuals Protocol's price is up a staggering 292% from its April low of $1.00, currently exchanging hands at $1.63 at the time of writing. The bullish momentum behind the token remains unrelenting, following several milestones, including the market capitalization surpassing the $1 billion mark.
VIRTUAL's rally can be attributed to several factors including a strong technical structure characterized by the SuperTrend indicator's buy signal and the price action above the 50-, 100- and 200-day EMAs.
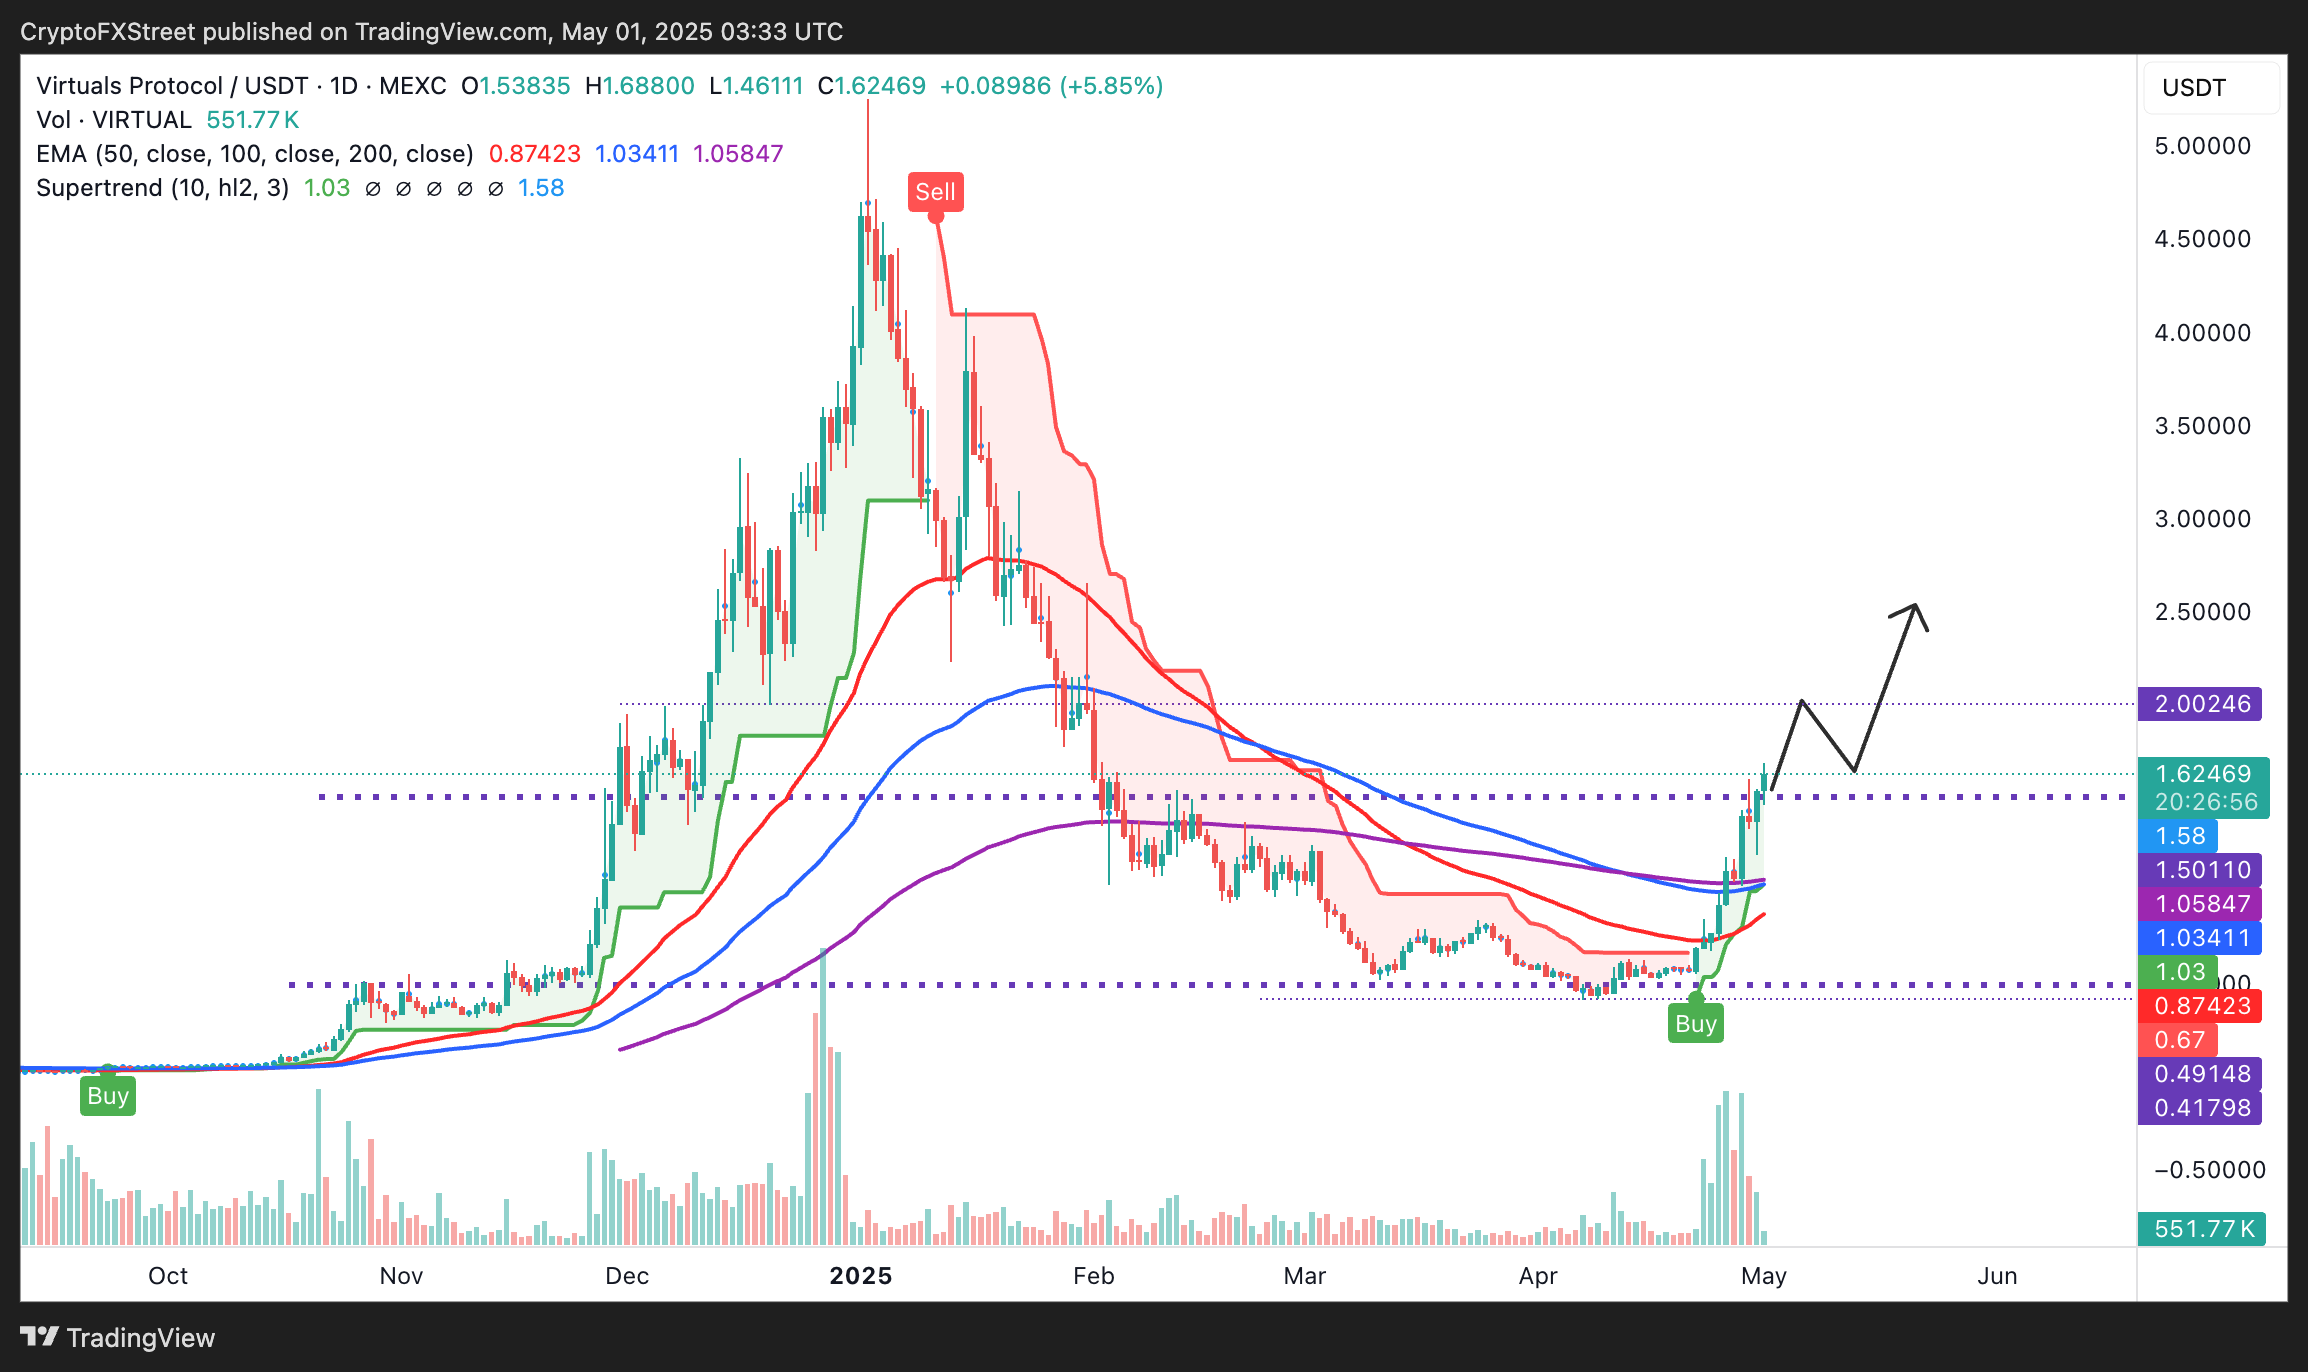
VIRTUAL/USDT daily chart
Traders would anticipate higher support at $1.50 to hold in the event of a reversal. At the same time, VIRTUAL's bullish momentum could accelerate towards the $2.00 level, which was tested in December and January as both support and resistance.
The potential upcoming crossing of the 100-day EMA above the 200-day EMA would encourage traders to seek more exposure to VIRTUAL, thereby igniting a strong tailwind.
Beyond the short-term support at $1.50, it would be prudent to prepare for varying eventualities, including losses that could test the confluence demand zone around $1.00, established by the 100- and 200-day EMAs.
Curve DAO's breakout aims for $1
Curve DAO's uptrend steadies at $0.72, supported by a golden cross pattern in the daily time frame. CRV cemented the bullish outlook in April after breaking out of a cup and handle pattern, as shown in the chart below. This elevated the token above the 50-, 100-, and 200-day EMAs, driving interest among traders.
On April 25, the 50-day EMA crossed above the 200-day EMA, forming a golden cross that confirmed bullish dominance and signaled a strong upward trajectory as the path of least resistance.
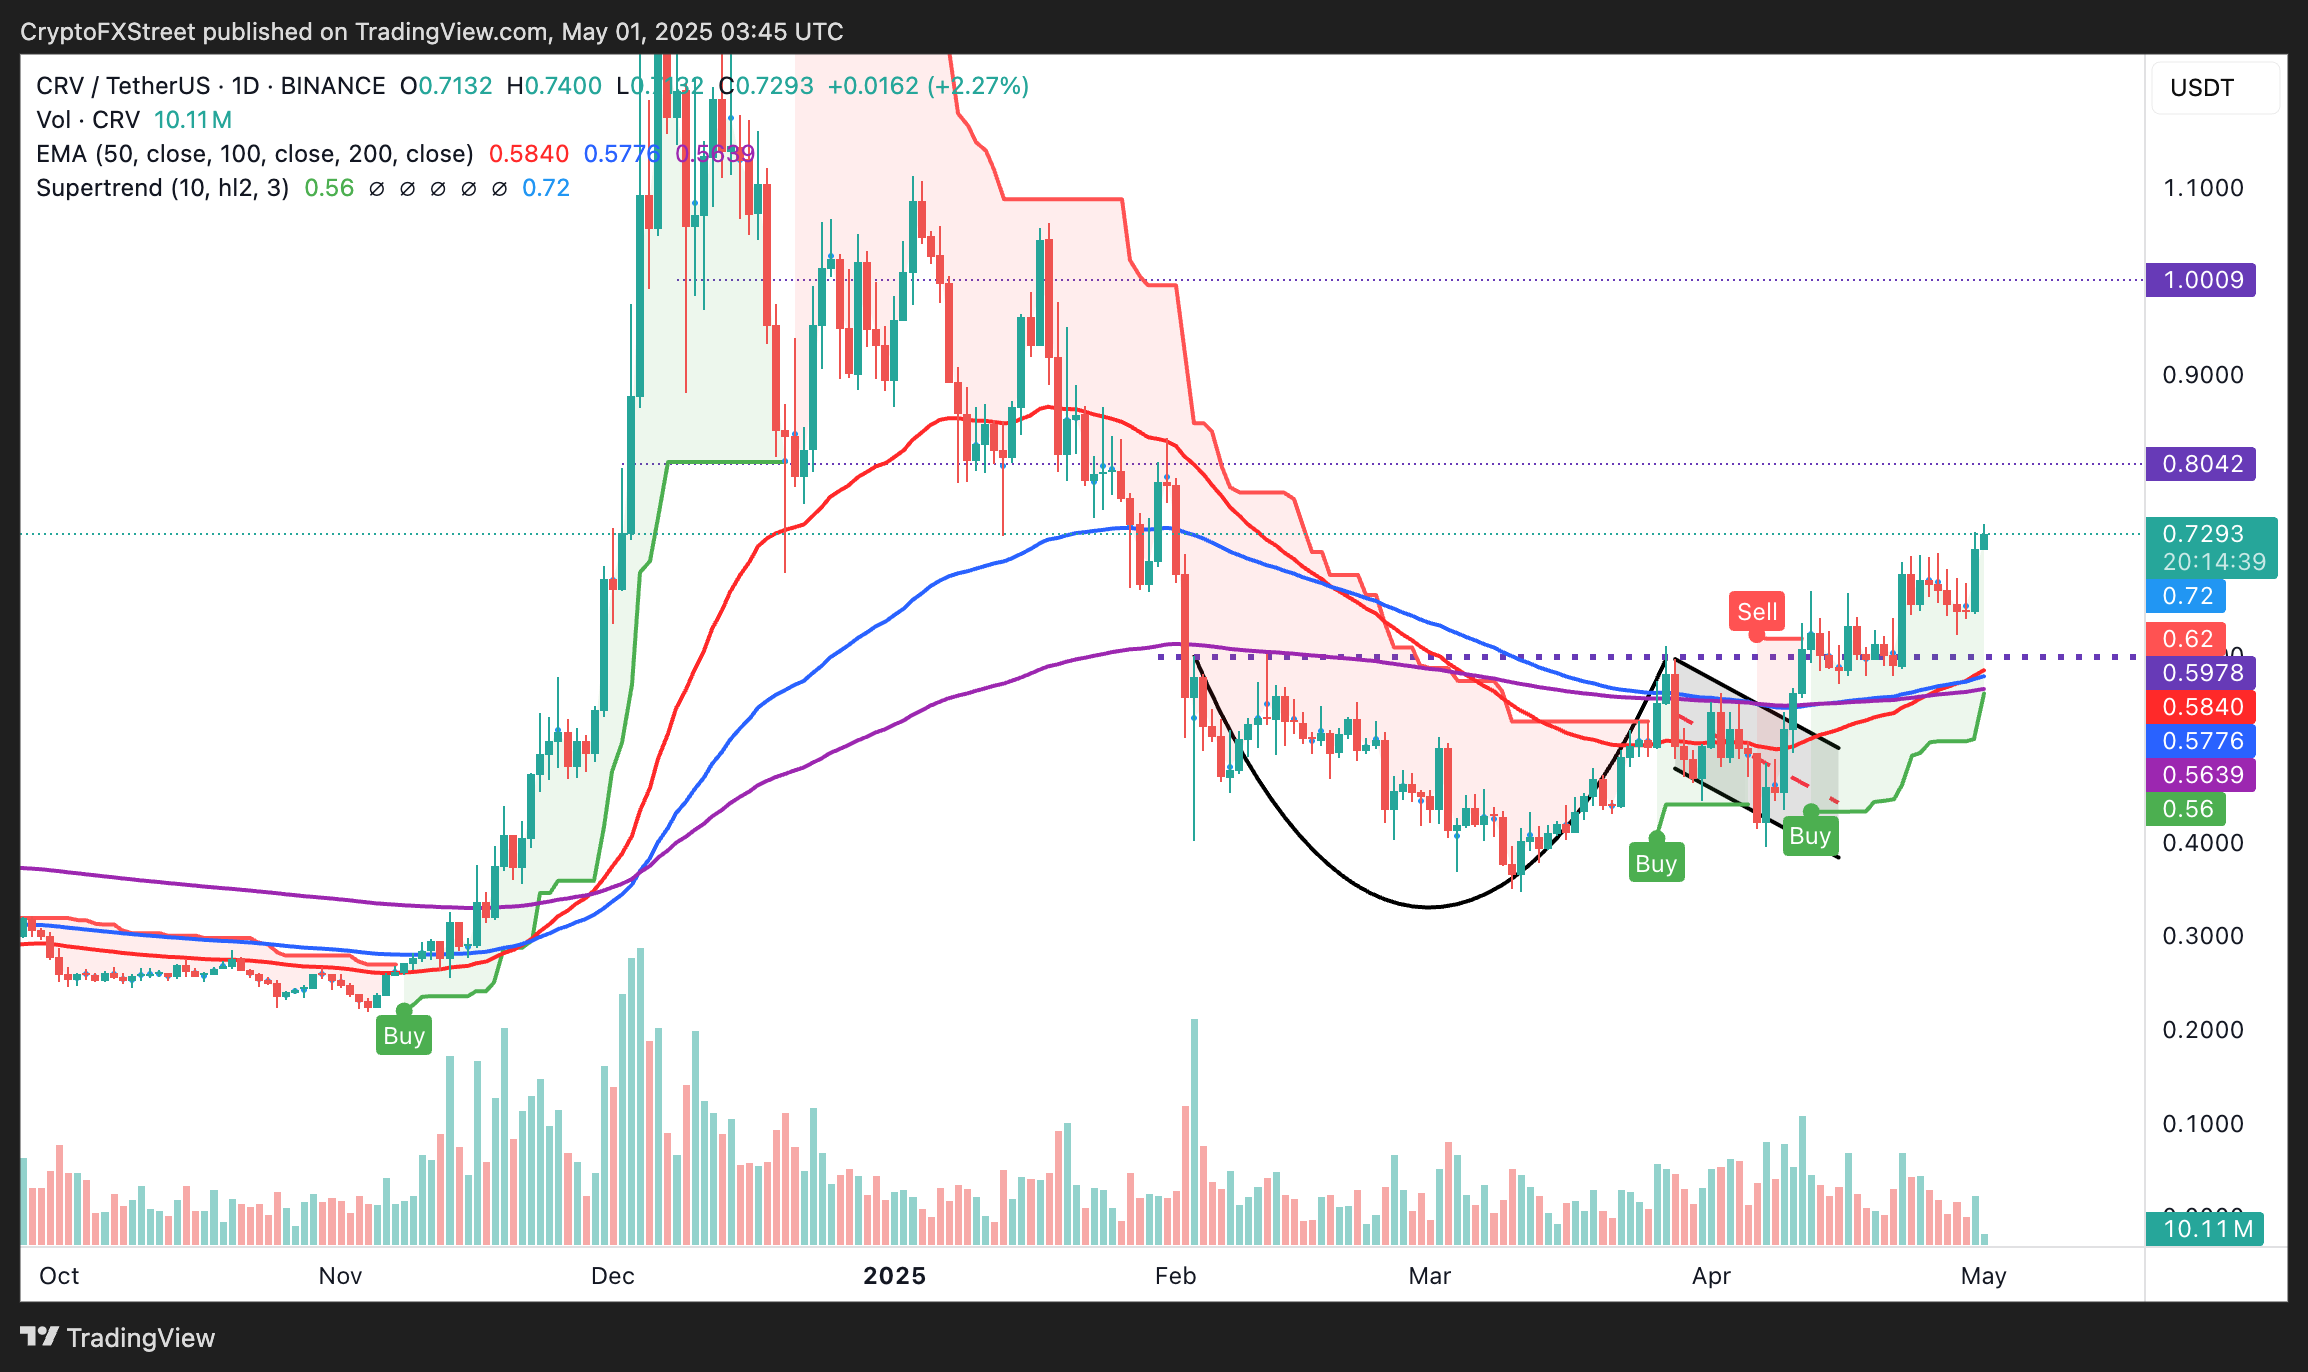
CRV/USD daily chart
Curve DAO may encounter resistance at $0.75, where traders could decide to take profit, thus weakening the uptrend. Beyond this level, investors would monitor CRV's reaction to the supply zones at $0.80 and $1.00, which have previously been tested as support and resistance levels.
Cryptocurrency prices FAQs
Token launches influence demand and adoption among market participants. Listings on crypto exchanges deepen the liquidity for an asset and add new participants to an asset’s network. This is typically bullish for a digital asset.
A hack is an event in which an attacker captures a large volume of the asset from a DeFi bridge or hot wallet of an exchange or any other crypto platform via exploits, bugs or other methods. The exploiter then transfers these tokens out of the exchange platforms to ultimately sell or swap the assets for other cryptocurrencies or stablecoins. Such events often involve an en masse panic triggering a sell-off in the affected assets.
Macroeconomic events like the US Federal Reserve’s decision on interest rates influence crypto assets mainly through the direct impact they have on the US Dollar. An increase in interest rate typically negatively influences Bitcoin and altcoin prices, and vice versa. If the US Dollar index declines, risk assets and associated leverage for trading gets cheaper, in turn driving crypto prices higher.
Halvings are typically considered bullish events as they slash the block reward in half for miners, constricting the supply of the asset. At consistent demand if the supply reduces, the asset’s price climbs.
Artigos Recomendados


