

Bitcoin Weekly Forecast: Is BTC out of the woods?
- The German Government's deposit of over 1,700 BTC in exchanges creates FUD in markets.
- On-chain data shows no signs of Defi liquidation for BTC, and a decline in spot Bitcoin ETFs holdings signals a downward correction.
- MicroStrategy, a significant BTC investor, acquires 11,931 BTC worth $786 million, while VanEck's Bitcoin ETF goes live on Australia's largest stock exchange.
- Technical indicators suggest that Bitcoin's price is poised for further correction before the uptrend can resume.
Bitcoin (BTC) appears poised for a slight decline this week, influenced by factors such as the German Government's deposit of over 1,700 BTC in exchanges, decreasing outflows in US spot ETFs, and on-chain data indicating no signs of BTC DeFi liquidation. Technical indicators suggest BTC might experience a 3% correction in the near term before continuing its upward trajectory.
German Government deposits create FUD in markets
Data from Lookchain show that the German Government has deposited 1,700 BTC worth $110.88 million on multiple centralized exchanges this week. These deposits have caused FUD (Fear, Uncertainty and Doubt) in the crypto markets, leading to a 3% decline in BTC’s price from its Monday high of $67,298 to around $64,300 at the time of writing.
If this sell-off continues, FUD in the crypto markets could increase, driving Bitcoin’s price down even as the German Government still holds $3.06 billion worth of BTC.
Beware of the 47,179 $BTC ($3.06B) dump from German Government!
— Lookonchain (@lookonchain) June 20, 2024
In the past 2 days, German Government has deposited 1,700 $BTC($110.88M) to #Coinbase, #Kraken, and #Bitstamp.
German Government currently has 47,179 $BTC($3.06B) left. pic.twitter.com/ZN9s4vfktY
Bitcoin shows no sign of Defi liquidation
Aave and Compound Finance are money market protocols built on the Ethereum blockchain where users can earn interest by lending their assets and borrowers can obtain loans by using their assets as collateral. Liquidation on the Defi platform Aave and Compound for BTC refers to selling a borrower's collateralized Bitcoin assets to repay a portion or all of their outstanding debt.
However, suppose the value of the borrowed assets exceeds a certain threshold about the collateral's value, known as the liquidation threshold. In that case, the borrower's position becomes vulnerable to liquidation.
When a borrower's position is liquidated, their BTC collateral is sold on the open market to cover the debt. This ensures that lenders are not left with losses due to undercollateralized loans.
When such liquidation occurs on Aave and Compound, it is denoted by a spike in the chart below.
Historically, these spikes are followed by market recoveries due to immediate forced selling and opportunistic buying from key stakeholders.
According to data from Santiment’s Defi liquidations on Aave and Compound Finance, BTC’s recent price decline from $67,298 to $66,060 this week has seen no liquidation in Defi platforms. This indicates that BTC could first face a price decline before it can recover to aim for its all-time high reached on March 14 at $73,777.
 [09.48.25, 21 Jun, 2024]-638545560577488630.png)
BTC Defi Liquidation chart
Bitcoin spot ETFs display weakness
According to CryptoQuant data for Bitcoin ETFs, the Historical Bitcoin Holdings Trend (Aggregated) metric provides a retrospective view of the cumulative Bitcoin holdings across all ETF issuers. Increases or decreases in the metric indicate shifts in institutional demand for Bitcoin exposure or changes in investment strategies.
US spot Bitcoin ETFs have experienced continued outflows for a second consecutive week. The holding amount of Bitcoin in ETFs dropped from 872.9k on Monday to 872.6k on Thursday. This reduction hints at a minor waning of investor confidence, potentially foreshadowing a temporary dip in Bitcoin's price.
 (1)-638545651740448118.png)
BTC ETF Historical Bitcoin Holdings Trend (Aggregated) chart
Some positive signs for BTC
MicroStrategy Incorporated announced on Thursday the acquisition of another major purchase of Bitcoin, buying 11,931 BTC for about $786 million.
This purchase follows their issuance of Convertible Senior Notes to investors, the company said in a statement. It marks MicroStrategy's third-largest Bitcoin acquisition, surpassed only by purchases on February 24, 2021, and March 10, 2024. With this latest move, MicroStrategy holds a total of 226,331 BTC,. The company currently enjoys unrealized profits of $6.3 billion.
Moreover, VanEck's spot Bitcoin ETF has officially launched on Australia's largest stock exchange, as announced by the Australian Securities Exchange on its official Twitter account. This debut marks a significant milestone in advancing Bitcoin's integration and acceptance within the global financial ecosystem.
ASX welcomes VBTC to the exchange! Congratulations to the @vaneck_au team for launching the first crypto ETF on ASX. https://t.co/QM7iYfNZRO #ASXBell pic.twitter.com/f7MiHDqIoZ
— ASX The heart of Australia's financial markets (@ASX) June 20, 2024
BTC is not out of the woods yet
Bitcoin price was rejected by the weekly resistance level of $67,147 on Monday and is currently trading inside a descending channel, drawn from multiple swing highs and lows between early June and mid-June, as shown in the daily chart below.
If BTC continues to decline, it could find support at $62,451, the 61.8% Fibonacci retracement level from a swing low of $56,552 on May 1 to a swing high of $71,995 on May 21.
If the $62,451 support holds and BTC breaks above the descending channel, it could rally 7.5% to reach its previous resistance level of $67,147.
The Relative Strength Index (RSI) and the Awesome Oscillator (AO) on the daily chart are below their respective mean levels of 50 and zero. If bulls are indeed making a comeback, then both momentum indicators must maintain their positions above their respective mean levels.
This development would provide additional momentum to the recovery rally.
If bullish sentiment prevails and the overall cryptocurrency market shows optimism, BTC may extend its rally by 6% from $67,147 to retest its previous resistance level of $71,280.
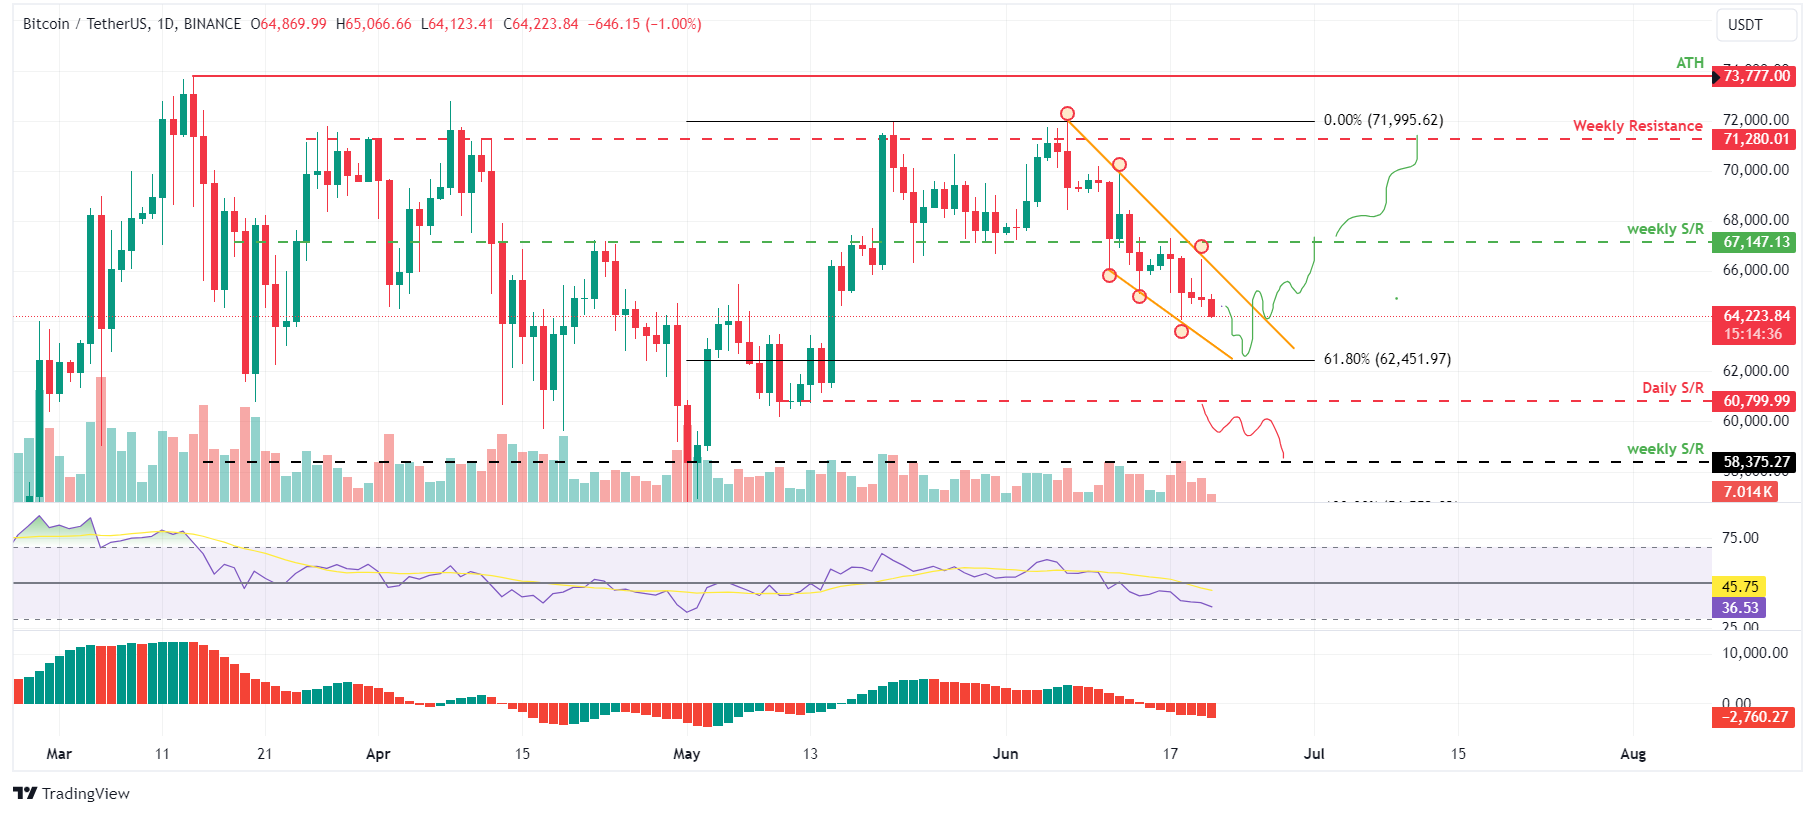
BTC/USDT 1-day chart
However, if Bitcoin price breaks and closes below its daily support level of $60,800, the bullish thesis could be invalidated, leading to a 4% crash to its weekly support level of $58,375.
Artigos Recomendados


