

Natural Gas holds near two-month high as more US sanctions on Iranian Oil sector loom
- Natural Gas price hits a fresh two-month high.
- Gas prices soar as the US is set to broaden sanctions against Iran’s Oil sector.
- The US Dollar Index partially recovers from Tuesday’s decline, driven by a big miss on PMI numbers.
Natural Gas (XNG/USD) holds onto recent gains on Wednesday after a two-day rally sparked by a possible escalation of tensions in the Middle East as the US is set to extend sanctions on Iran’s Oil sector. Earlier last week, the Biden administration said it was readying a sanction package that would not disrupt Oil exports to avoid ramping up prices. However, by backtracking and now issuing sanctions on the Iranian oil sector, tensions could flare up again in the coming days, fuelling prices in the overall energy space.
Meanwhile, the US Dollar Index (DXY), which tracks the US Dollar’s value against six major currencies, fell sharply on Tuesday after a big miss on the preliminary US Purchasing Managers Index (PMI) numbers for April. Apart from the softer-than-expected data, the Manufacturing component fell below the 50 level, showing a contraction in the sector. The US Dollar is recovering though on Wednesday, with traders assessing expectations about the time of the initial interest rate cut from the US Federal Reserve (Fed)..
Natural Gas is trading at $2.15 per MMBtu at the time of writing.
Natural Gas news and market movers: Tensions and supply issues
- Supply issues towards Europe as the Hammerfest Liquefied Natural Gas (LNG) plant in Norway is completely shut down due to a leak, Bloomberg reports. Expectations are for it to remain closed until at least Friday.
- Marco Saalfrank, Head of Continental Europe Merchant Trading and Member of the Management Board of Axpo Solutions AG, said in an interview with Bloomberg that the Gas market is currently sentiment-driven as well, which is increasing volatility as Europe still lacks structural changes to replace the Gas supply from Russia.
- The UK is also facing some issues, with the unforeseen outage of the Elgin Franklin field in the UK North Sea by at least another day.
- US sanctions on Iran’s OIl sector are set to be signed by US President Joe Biden next week after the US Senate passed tougher measures.
Natural Gas Technical Analysis: Markets surprised by tougher sanctions
Natural Gas finally broke out of the range in which had been stuck since the end of January, between $1.60 and $2.11. A near $0.50 range that is now broken after the US is set to extend sanctions on Iran’s Oil sector. In the ripple effect of higher oil prices and elevated tensions in the Middle East, a stronger US Dollar could become a side effect of this bill being signed by US President Joe Biden next week.
On the upside, the blue line at $2.11, the 2023 low, and the 100-day Simple Moving Average (SMA) at $2.12 have been broken, resulting in a fresh two-month high. Further up, the next resistance level is the January 25 high at near $2.33.
With the firm break of the $2.11 area, the above mentioned elements (the 100-day SMA and the pivotal blue line) should now be acting as support. Traders could expect a retrace under some profit-taking, which this level should be able to withstand. Should it still break below, XNG/USD could experience a movement towards $1.92, testing a bounce off the red descending trend line.
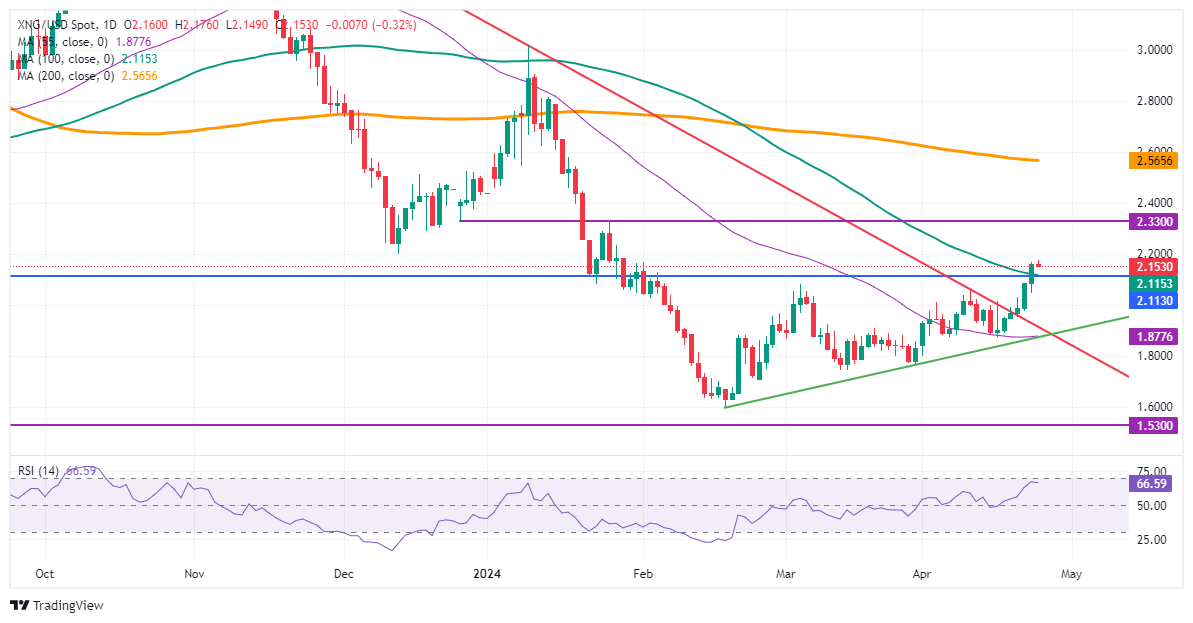
Natural Gas: Daily Chart
Natural Gas FAQs
Supply and demand dynamics are a key factor influencing Natural Gas prices, and are themselves influenced by global economic growth, industrial activity, population growth, production levels, and inventories. The weather impacts Natural Gas prices because more Gas is used during cold winters and hot summers for heating and cooling. Competition from other energy sources impacts prices as consumers may switch to cheaper sources. Geopolitical events are factors as exemplified by the war in Ukraine. Government policies relating to extraction, transportation, and environmental issues also impact prices.
The main economic release influencing Natural Gas prices is the weekly inventory bulletin from the Energy Information Administration (EIA), a US government agency that produces US gas market data. The EIA Gas bulletin usually comes out on Thursday at 14:30 GMT, a day after the EIA publishes its weekly Oil bulletin. Economic data from large consumers of Natural Gas can impact supply and demand, the largest of which include China, Germany and Japan. Natural Gas is primarily priced and traded in US Dollars, thus economic releases impacting the US Dollar are also factors.
The US Dollar is the world’s reserve currency and most commodities, including Natural Gas are priced and traded on international markets in US Dollars. As such, the value of the US Dollar is a factor in the price of Natural Gas, because if the Dollar strengthens it means less Dollars are required to buy the same volume of Gas (the price falls), and vice versa if USD strengthens.
Artigos Recomendados


