
EUR/GBP is struggling to regain the 0.8400 level despite the pause on EU tariffs
- The Euro picked up from Friday’s lows, but it remains capped below 0.8400,
- A pause on US tariffs on EU products has provided some support to the Euro.
- The broader EUR/GBP trend remains bearish, with 0.8325 support in play.
The Euro ticked up from the nearly two-month low hit on Friday, but it remains unable to post a significant recovery despite the upbeat news on the US tariffs’ domain. The pair is struggling to return above the 0.8400 level, which keeps the broader bearish trend intact.
US President Donald Trump soothed investors over the weekend, announcing a pause on his plans to impose 50% tariffs on all imports from the EU. Trump said that, after a “very nice call” with EU Commission President Ursula von der Leyen, they decided to pause tariffs until July 9, in order to reach a good deal.
Markets are closed in the UK on the Spring Bank Holiday, and trading volumes are likely to be somewhat lighter. In Europe, the main focus will be on ECB President Christine Lagarde’s speech, which might provide further insight into the bank’s monetary policy plans.
The Euro is trending lower, with 0.8325 support on the bears’ focus
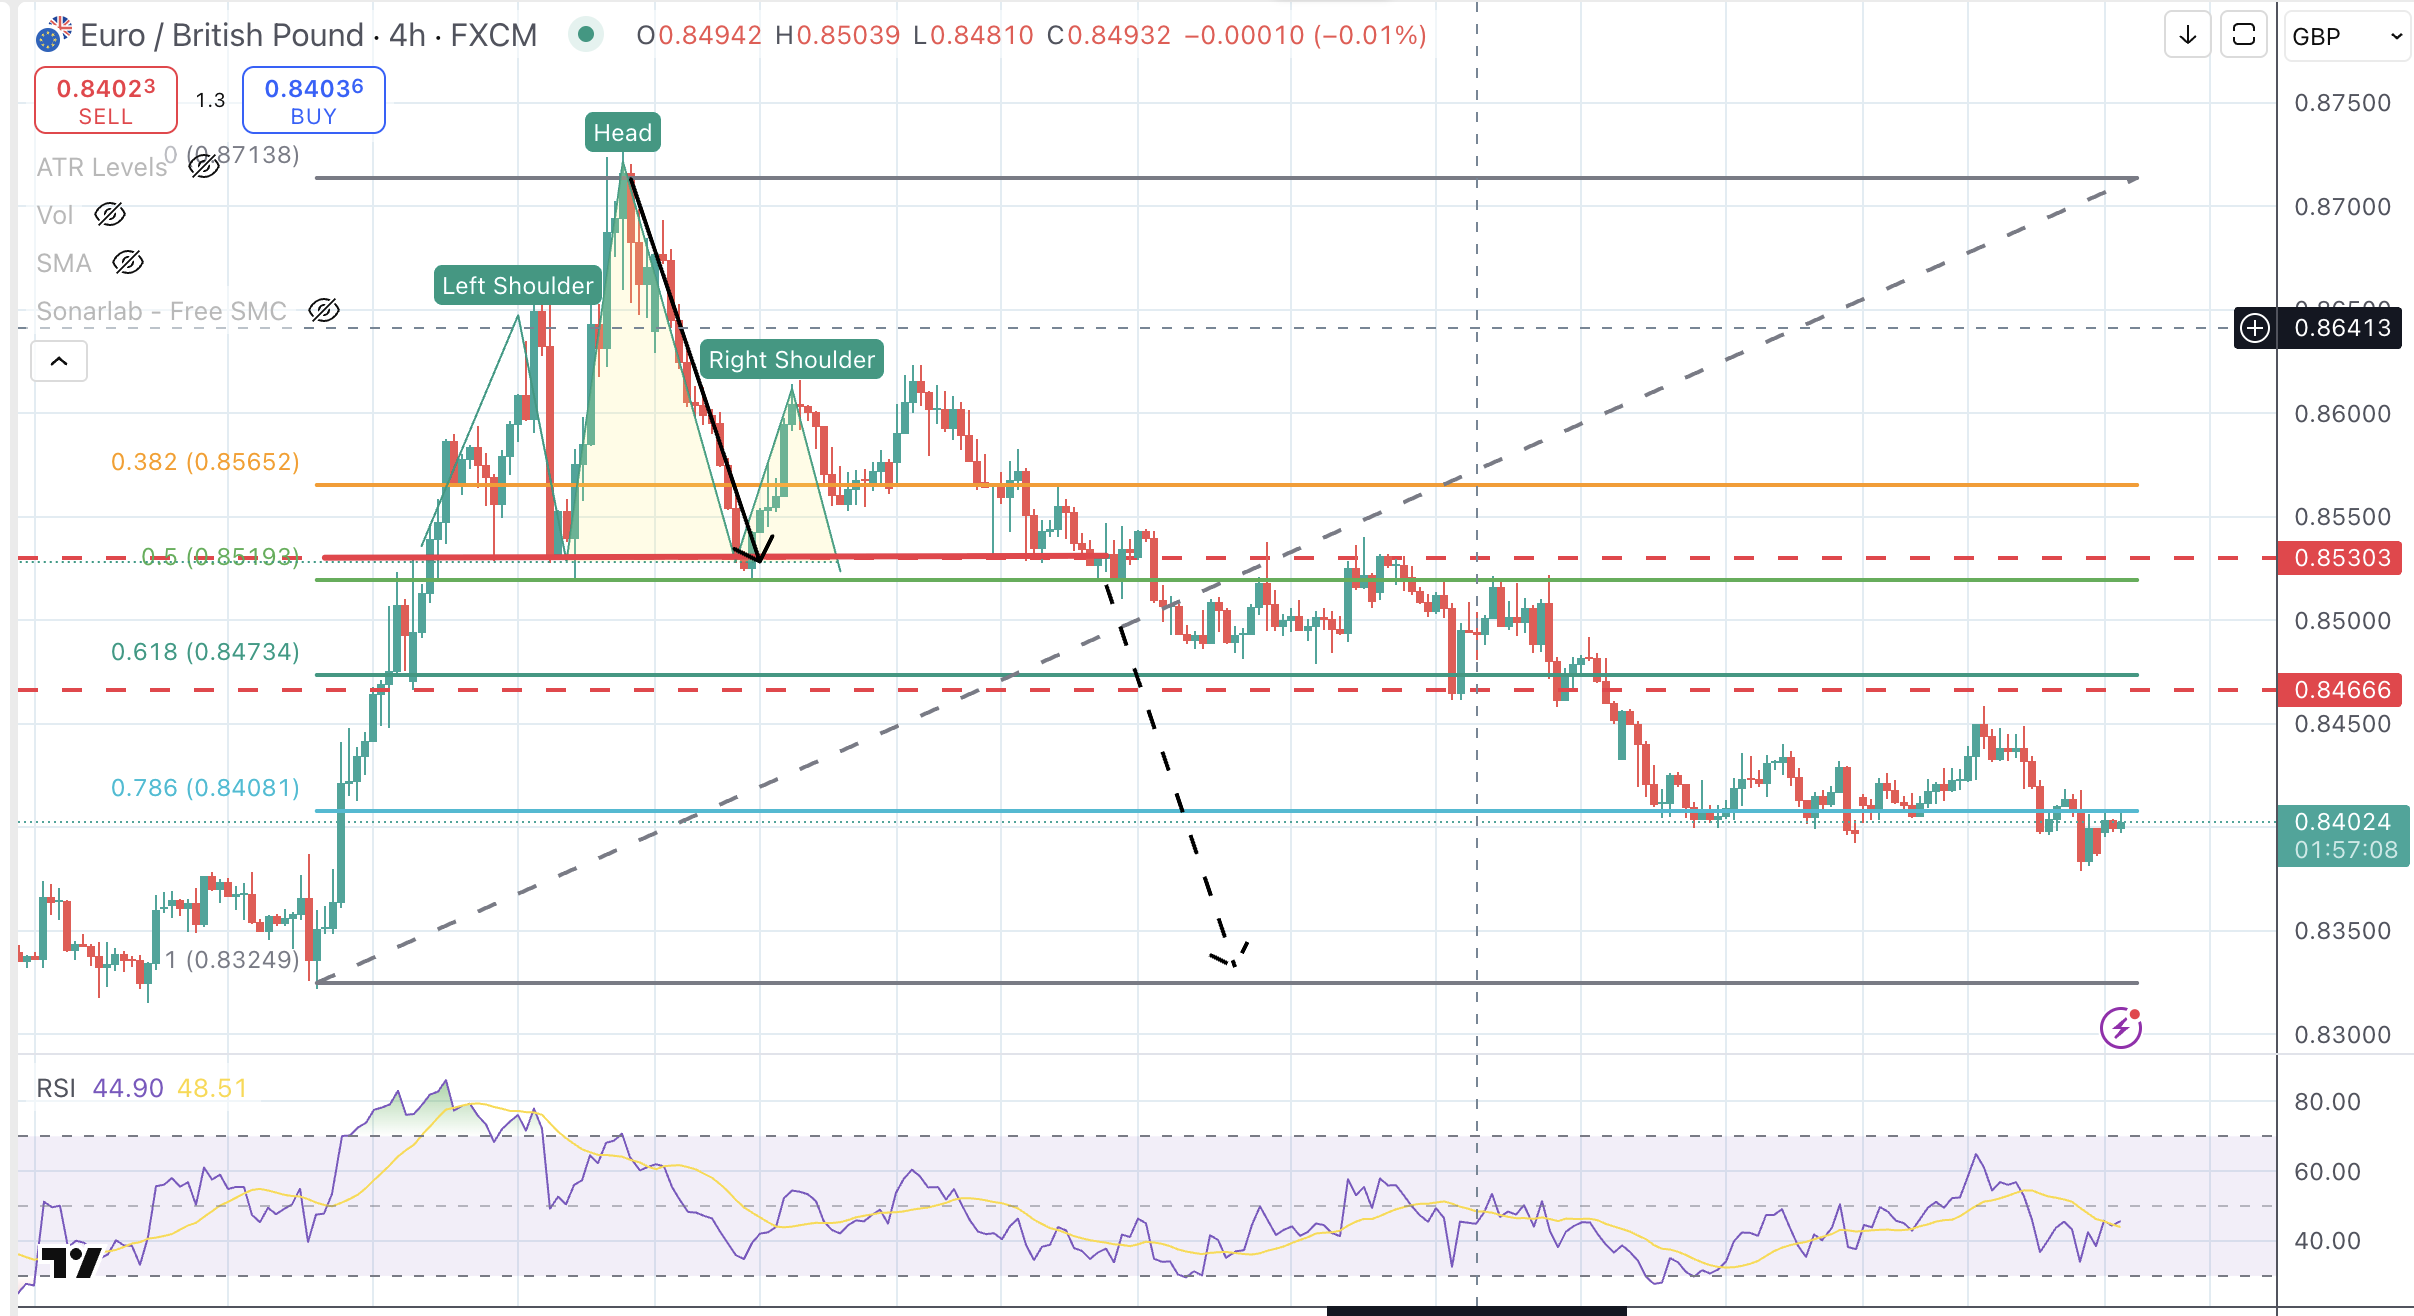
From a technical standpoint, the Euro is in a clear downtrend, posting lower highs and lower lows, with no clear signs of a trend reversal as of yet.
The pair confirmed a bearish Head & Shoulders’ pattern, breaching the 0.8530 neckline in late April, and has extended below the 78.6% Fibonacci retracement, at 0.8400, which is now acting as resistance.
Failure to return above 0.8400-0.8420 would increase pressure towards the 0.8325 area, which is the late March-early April bottom and the measured target of the mentioned H&S pattern.
On the upside, above 0.8400, the targets are 0.8465 and 0.8530.
EUR/GBP 4-hour Chart
Euro PRICE Today
The table below shows the percentage change of Euro (EUR) against listed major currencies today. Euro was the strongest against the Japanese Yen.
| EUR | USD | GBP | JPY | CAD | AUD | NZD | CHF | |
|---|---|---|---|---|---|---|---|---|
| EUR | 0.39% | 0.00% | 0.59% | 0.09% | -0.14% | -0.26% | 0.29% | |
| USD | -0.39% | -0.38% | 0.16% | -0.29% | -0.51% | -0.64% | -0.10% | |
| GBP | -0.01% | 0.38% | 0.25% | 0.08% | -0.15% | -0.27% | 0.30% | |
| JPY | -0.59% | -0.16% | -0.25% | -0.44% | -0.68% | -0.86% | -0.26% | |
| CAD | -0.09% | 0.29% | -0.08% | 0.44% | -0.21% | -0.35% | 0.21% | |
| AUD | 0.14% | 0.51% | 0.15% | 0.68% | 0.21% | -0.16% | 0.44% | |
| NZD | 0.26% | 0.64% | 0.27% | 0.86% | 0.35% | 0.16% | 0.57% | |
| CHF | -0.29% | 0.10% | -0.30% | 0.26% | -0.21% | -0.44% | -0.57% |
The heat map shows percentage changes of major currencies against each other. The base currency is picked from the left column, while the quote currency is picked from the top row. For example, if you pick the Euro from the left column and move along the horizontal line to the US Dollar, the percentage change displayed in the box will represent EUR (base)/USD (quote).
Artigos Recomendados


