Os CFD são instrumentos complexos e apresentam um risco elevado de perda rápida de dinheiro devido à alavancagem. Deve considerar se compreende o funcionamento dos CFD e se pode correr o risco elevado de perder o seu dinheiro.
    O Mitrade Insights dedica-se a fornecer aos investidores informações financeiras ricas, oportunas e valiosas para ajudá-los a entender a situação do mercado e encontrar oportunidades de negociação oportunas.
    2021
    Melhor Provedor de Notícias e Análise
    FxDailyInfo
    2022
    Melhores Recursos Educacionais de Forex Global
    International Business Magazine

    EUR/JPY Price Analysis: Bullish run faces overbought risks, hovers around 169.00

    Fonte Fxstreet
    26/04/2024 20:45
    • EUR/JPY climbs nearing the pivotal 169.00 mark, propelled by strong risk appetite and market gains.
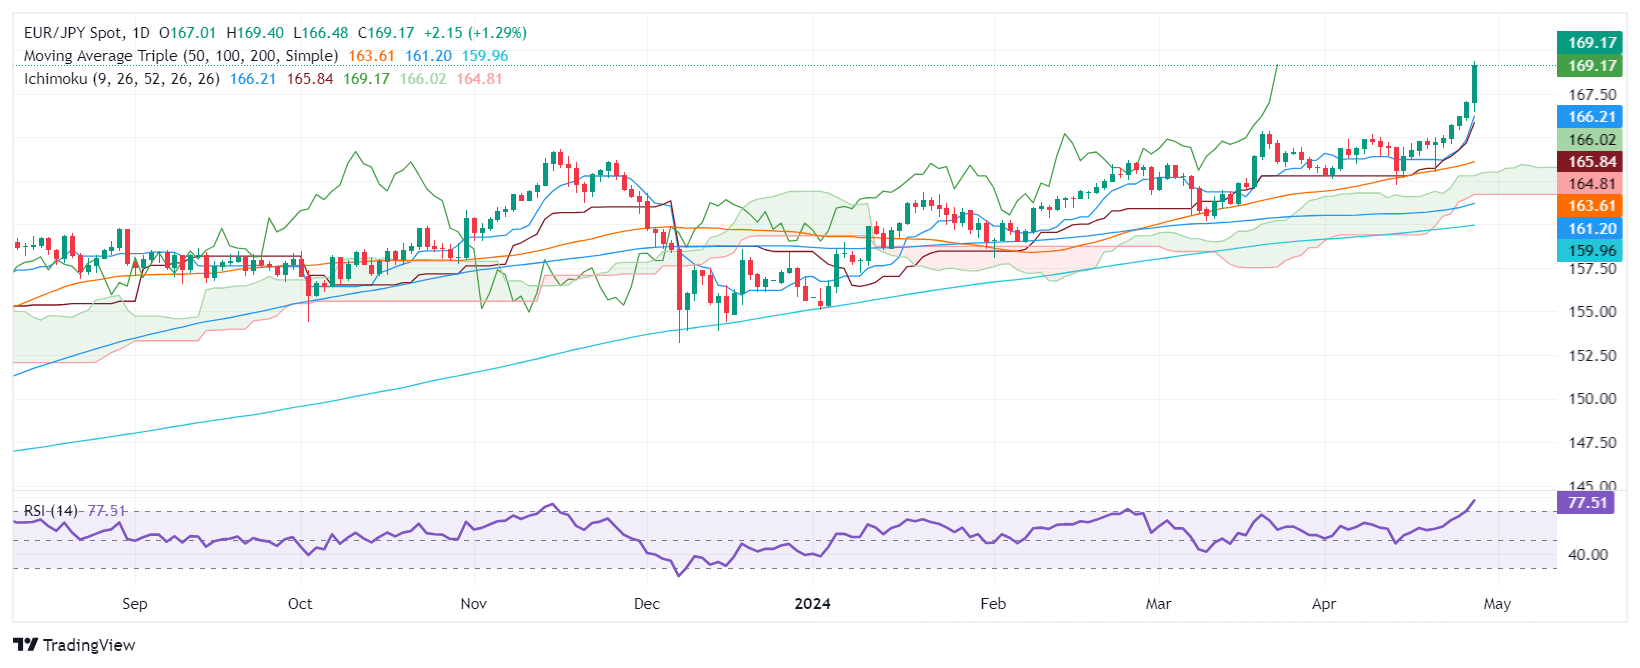
    • Technical analysis shows a robust uptrend, though an RSI of 76.00 signals overbought conditions.
    • If the pair surpasses 169.00, it faces resistance at the July 2008 high of 169.97, closely followed by the key 170.00 level.
    • A drop below 169.00 could lead to a pullback to 168.00, further potential supports at the Tenkan-Sen at 166.20 and the Kijun-Sen at 165.84.

    The EUR/JPY rallies toward the 169.00 figure yet remains shy of breaching it as risk appetite improves, as Wall Street depicts. At the time of writing, the cross-pair trades at 168.89 and is up by 1.12%.

    EUR/JPY Price Analysis: Technical outlook

    The daily chart depicts the EUR/JPY as upward biased, even though the rally has overextended. The Relative Strength Index (RSI) is at 76.00, usually seen as overbought, but due to the strength of the uptrend, the 80.00 level is seen as the most extreme condition.

    If buyers reclaim the 169.00, the next supply zone would be the July 2008 high of 169.97. Once those two levels are cleared, the next supply zone would be 170.00.

    On the flip side, a daily close below 169.00, would pave the way for a retracement to 168.00. Subsequent losses are seen below the Tenkan-Sen at 166.20, followed by the Kijun-Sen at165.84

    EUR/JPY Price Action – Daily Chart
    EUR/JPY

    Overview
    Today last price 168.88
    Today Daily Change 1.86
    Today Daily Change % 1.11
    Today daily open 167.02
     
    Trends
    Daily SMA20 164.5
    Daily SMA50 163.46
    Daily SMA100 161.07
    Daily SMA200 159.9
     
    Levels
    Previous Daily High 167.09
    Previous Daily Low 165.93
    Previous Weekly High 165.03
    Previous Weekly Low 162.67
    Previous Monthly High 165.36
    Previous Monthly Low 160.22
    Daily Fibonacci 38.2% 166.65
    Daily Fibonacci 61.8% 166.37
    Daily Pivot Point S1 166.27
    Daily Pivot Point S2 165.52
    Daily Pivot Point S3 165.11
    Daily Pivot Point R1 167.43
    Daily Pivot Point R2 167.84
    Daily Pivot Point R3 168.59


    Isenção de responsabilidade: Apenas para fins informativos. O desempenho passado não é indicativo de resultados futuros.
    placeholder
    USD/CHF trades on a positive note above 0.9050, focus on Fed’s Daly’s speechThe USD/CHF pair trades on a stronger note around 0.9085 during the early European session on Thursday.
    Fonte  Fxstreet
    The USD/CHF pair trades on a stronger note around 0.9085 during the early European session on Thursday.
    placeholder
    USD/JPY holds positive ground above 155.50 following the BoJ Summary of OpinionsThe USD/JPY pair trades in positive territory for the fourth consecutive day around 155.60 during the early Asian trading hours on Thursday.
    Fonte  Fxstreet
    The USD/JPY pair trades in positive territory for the fourth consecutive day around 155.60 during the early Asian trading hours on Thursday.
    placeholder
    EUR/USD trades sideways amid steady US Dollar despite firm Fed rate cut betsEUR/USD strives for a direction, trading sideways around 1.0770 in Monday’s European session.
    Fonte  Fxstreet
    EUR/USD strives for a direction, trading sideways around 1.0770 in Monday’s European session.
    goTop
    quote