

CoreWeave Stock Price Forecast: Plunges Over 15% to Lowest Since Late July as DA Davidson Warns High Financing Costs Could Cause Total Loss for Shareholders

Source Tradingkey

TradingKey - On October 14, US Eastern Time, CoreWeave (CRWV) saw its stock price plummet over 15%, hitting a new low since late July.

D.A. Davidson analyst Gil Luria said on the Prof G Markets podcast that once the AI investment boom cools down, high borrowing costs could prevent the AI cloud service provider from meeting its debt obligations, potentially causing shareholders to suffer a total loss.

Luria remains bullish on AI demand, but questioned CoreWeave's return on investment. He stated that the company's borrowing cost is around 9%, while its estimated return on investment is only about 1%; even if it reaches the company's target of 4% to 5% as he noted, it would still fall short of its financing costs. He compared it to borrowing money at 9% to buy U.S. Treasuries yielding 5%.

CoreWeave is currently seeking to bring in insurance capital to lower its financing costs. According to an interview with the Financial Times, co-founder Brannin McBee hopes to obtain investment-grade ratings for more chip-collateralized debt to attract insurance capital and reduce financing costs. An $8.5 billion loan completed by the company earlier this year, backed by long-term computing power purchase contracts with Meta, was its first chip-collateralized loan to receive a full investment-grade rating. However, McBee admitted that loans supported by customer contracts from non-investment-grade AI labs have not yet met the entry standards for insurance capital.

In addition, as of the end of June, CoreWeave's debt and lease obligations stood at approximately $52 billion, while second-quarter interest expenses nearly doubled year-over-year to $640 million, bringing its debt level to about 5.8 times its annualized EBITDA. S&P assessed its financial risk as "aggressive".

Jordan Chalfin, an analyst at CreditSights, pointed out that yields on CoreWeave's unsecured bonds have risen to nearly 15%, as investors worry about a maturity mismatch between its long-term data center leases and shorter-term customer contracts.
6-f19d97f910144bee88922e6a8a99092d

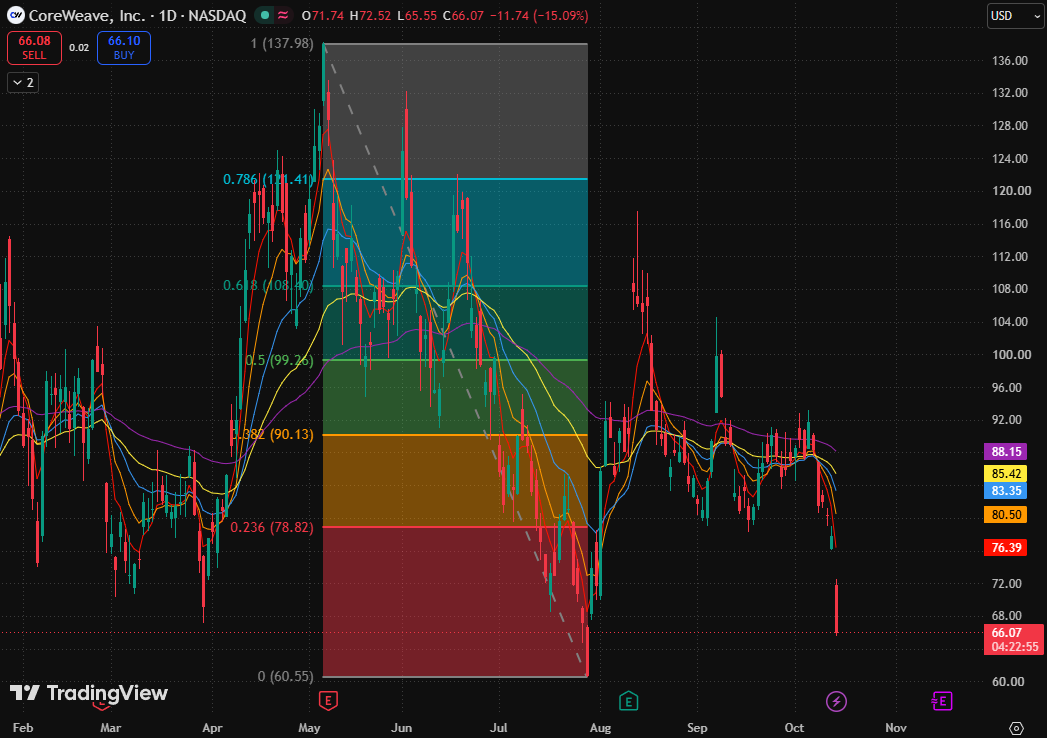
CoreWeave daily chart, Source: TradingView

Looking at CoreWeave's stock chart, the price is currently approaching its previous low of $60.55 from late July. It is currently in a gap-down accelerated decline within a downtrend, testing near the previous low. The price remains close to intraday lows, with no clear recovery from the drop yet.

From a Fibonacci perspective, after losing the 0.236 Fibonacci retracement level ($78.82), the stock price has entered the bottom area of the entire measured range, giving back most of its previous gains. The key here is not whether the decline is large enough, but whether the previous low can provide effective support.

Regarding moving averages, the 5-day, 10-day, 20-day, 80-day, and 160-day moving averages stand at $76.39, $80.50, $83.35, $85.42, and $88.15, respectively. The shorter-term moving averages are sequentially below the longer-term ones, forming a complete bearish alignment; the price also remains below all moving averages, indicating weak trend and positioning.

Looking ahead for the stock price, a short-term recovery will only be grounded if the stock holds above the previous low and reclaims the post-gap intraday high to form a double bottom. If the stock price convincingly breaks below the previous low, it will imply a further extension of the downward structure.

Disclaimer: For information purposes only. Past performance is not indicative of future results.
placeholder
US September CPI preview: inflation set to hit 3.7% — will the Fed hike in December?US September CPI lands Wednesday with headline inflation seen at 3.7% y/y and core at 0.2% m/m. December hike odds sit near 70% — here are the scenarios, the calendar and the key levels.
Author  Irene Q.
Oct 10, Sat
US September CPI lands Wednesday with headline inflation seen at 3.7% y/y and core at 0.2% m/m. December hike odds sit near 70% — here are the scenarios, the calendar and the key levels.
placeholder
Yen inches toward 159 as Tokyo reopens — where is the line in the sand before 160?USD/JPY traded around 158.5 on Tuesday after Monday's 158.60 close — the highest since September 24 — as Tokyo reopened and the market re-focused on two dates dominating the yen calendar: the G20 finance ministers' meeting in Bangkok on October 15 and the Bank of Japan's October 30 decision. Here are the three forces leaning on the yen, the positioning picture, and the scenarios into Wednesday's US CPI.
Author  Irene Q.
Oct 13, Tue
USD/JPY traded around 158.5 on Tuesday after Monday's 158.60 close — the highest since September 24 — as Tokyo reopened and the market re-focused on two dates dominating the yen calendar: the G20 finance ministers' meeting in Bangkok on October 15 and the Bank of Japan's October 30 decision. Here are the three forces leaning on the yen, the positioning picture, and the scenarios into Wednesday's US CPI.
placeholder
Strong profits, falling shares: bank earnings day one meets a memory-chip rout — with CPI and ASML aheadGoldman Sachs blew past estimates (EPS $17.01 vs $13.09 expected, profit +33%) while JPMorgan missed ($5.75 vs $5.93) and Wells Fargo fell 3% — yet the S&P 500 finished flat at 7,805.45, pinned below its record close as a memory-chip rout (SOX −2.67%, Micron under $1,000) kept the pressure on. Tonight brings the week's decider: US September CPI at 8:30 ET, then Bank of America, Morgan Stanley, BlackRock and ASML before the open. Here are the levels, both cases, and the watch list.
Author  Irene Q.
Yesterday 06: 06
Goldman Sachs blew past estimates (EPS $17.01 vs $13.09 expected, profit +33%) while JPMorgan missed ($5.75 vs $5.93) and Wells Fargo fell 3% — yet the S&P 500 finished flat at 7,805.45, pinned below its record close as a memory-chip rout (SOX −2.67%, Micron under $1,000) kept the pressure on. Tonight brings the week's decider: US September CPI at 8:30 ET, then Bank of America, Morgan Stanley, BlackRock and ASML before the open. Here are the levels, both cases, and the watch list.
placeholder
Bitcoin's V-shaped rebound: from $80,953 back above $83,000 — spot buyers step in as the Fed softens, but ETF outflows lingerBitcoin slid to $80,953 on October 13 — then snapped back above $83,000, reclaiming the 81,847–82,305 'golden zone' on spot-led buying as Williams and Waller cooled the Fed's hawkish tone and the dollar pulled back from its 18-month high. But October ETF outflows near $386 million and a fear-and-greed reading of 56 say the repair is unfinished. Here are the levels, the transmission chain and both cases ahead of tonight's US CPI.
Author  Suzie
Yesterday 06: 36
Bitcoin slid to $80,953 on October 13 — then snapped back above $83,000, reclaiming the 81,847–82,305 'golden zone' on spot-led buying as Williams and Waller cooled the Fed's hawkish tone and the dollar pulled back from its 18-month high. But October ETF outflows near $386 million and a fear-and-greed reading of 56 say the repair is unfinished. Here are the levels, the transmission chain and both cases ahead of tonight's US CPI.
placeholder
Gold Price Analysis Today | Forex Gold Analysis | XAU/USD Analysis - October 14, 2026Get the latest gold price analysis, forex gold insights, and XAU/USD analysis for October 14, 2026. Read on for the details.
Author  Mitrade
Yesterday 07: 11
Get the latest gold price analysis, forex gold insights, and XAU/USD analysis for October 14, 2026. Read on for the details.
goTop
quote