

Divergence Between Institutional Exit and Retail Frenzy: Dissecting the Earnings Truth Behind the ‘Magnificent Seven’ Split
Entering 2026, the U.S. stock market is exhibiting a structural game characterized by intense macro divergence. While surface-level market sentiment remains somewhat buoyant, underlying capital flows have undergone a fundamental reversal. According to the latest market monitoring, the rate at which retail investors are injecting capital into the stock market has surged to twice the five-year average. In sharp contrast, the "Magnificent Seven"—long regarded as market "safe havens"—have performed abysmally year-to-date, slumping by over 10% overall. This inverted phenomenon of "aggressive retail dip-buying vs. accelerated institutional exits" is a high-level warning signal for market risk management, indicating that the AI-centric single-track growth logic of recent years is facing severe challenges.
Extreme Divergence Between Retail Sentiment Fever and Institutional Confidence
From the microstructure of capital flows, the movement of funds throughout 2025 set the stage for the volatility of 2026. Arun Jain, a quantitative analyst at JPMorgan, noted in an early-year research report that net inflows from retail investors hit a record high in 2025, increasing by approximately 60% compared to 2024—a scale nearly twice the five-year average. Moving into January 2026, even as the Dow Jones Industrial Average experienced violent swings, including a single-day 900-point plunge on some trading days, retail investment behavior continued to exhibit strong pro-cyclical inertia. According to data from the trading platform Public, trading volume on such volatile days surged by 304% year-over-year, showing that retail investors are "buying the dip" at record scales.
However, at the macro level of confidence indices, the "Smart Money vs. Dumb Money Confidence Index" disclosed by financial data platform MacroMicro reveals a deeper crisis. Currently, the "Dumb Money" index, representing retail sentiment, is in an extremely high range of 0.7 to 0.8, reflecting a widespread market illusion of optimism. Conversely, the "Smart Money" confidence index, representing professional institutions and contrarian investors, has fallen to a low of 0.3 to 0.5. Historically, such extreme confidence divergence occurred in late 2018, late 2021, and early 2022, and was often followed by deep and sustained valuation corrections.
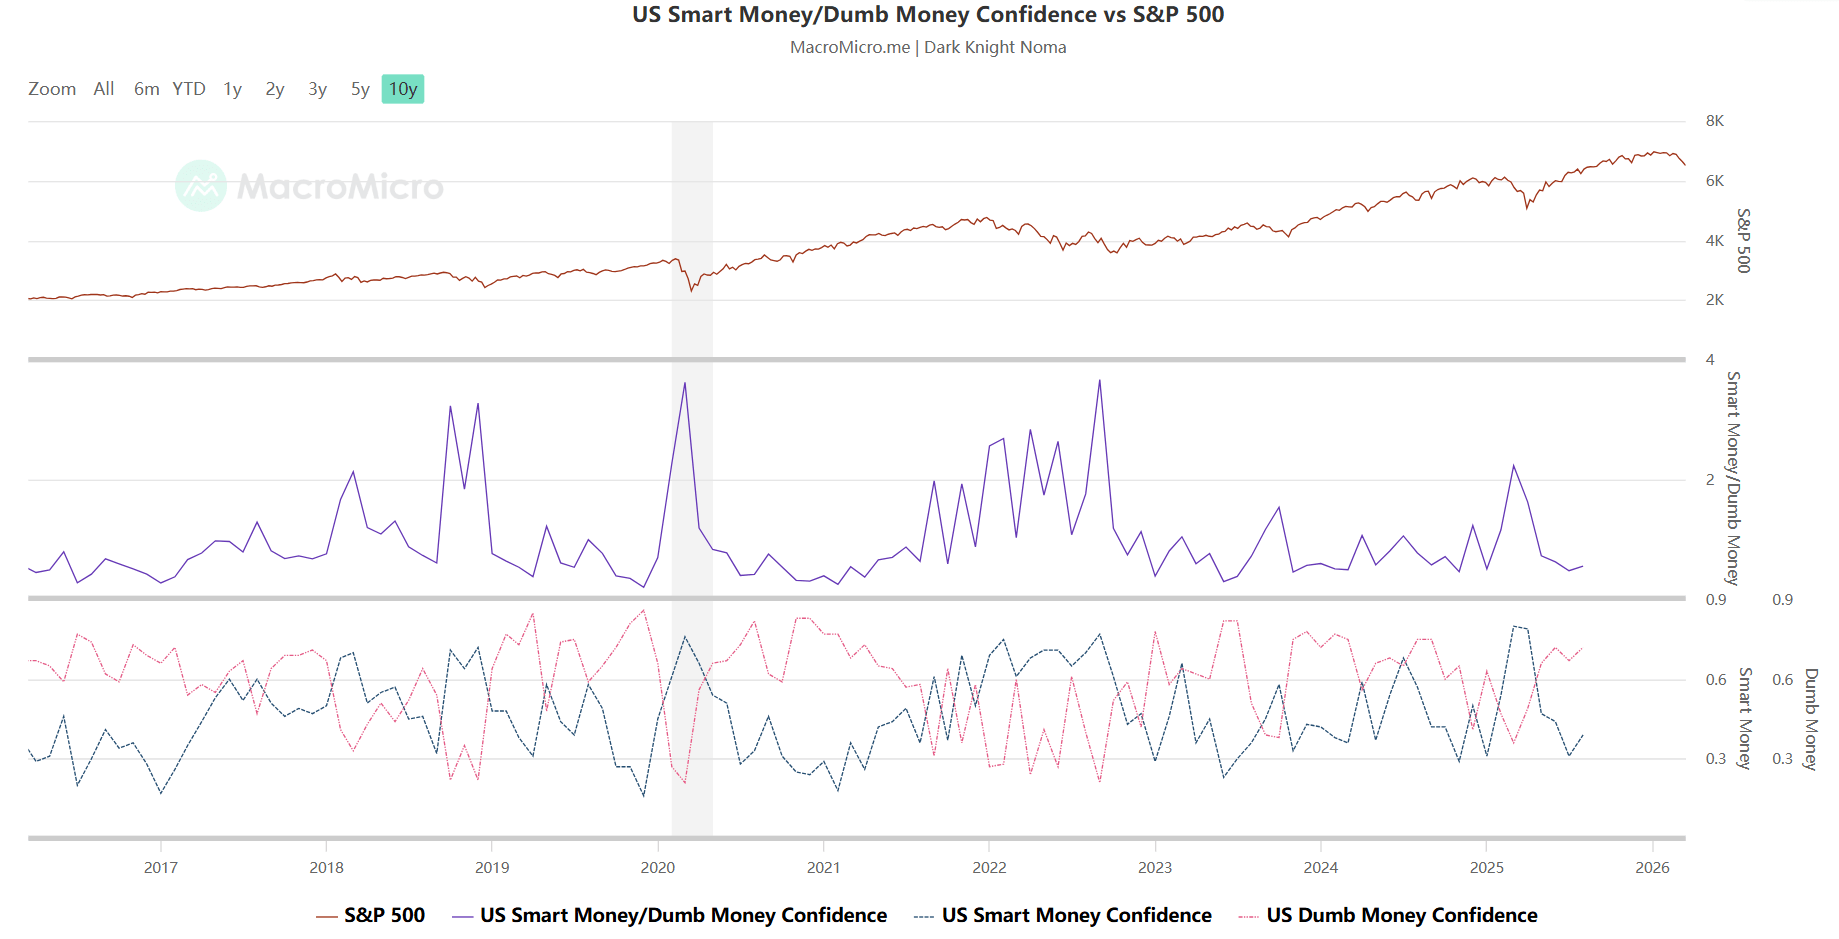
Source: MacroMicro
According to retail fund flows from Robinhood, retail positions remain highly concentrated in past winners such as NVIDIA, Tesla, Apple, Microsoft, and Palantir (PLTR). They have even begun pouring into gold ETFs to hedge risk. This allocation strategy, based on the "rear-view mirror effect," is prone to evolving into a liquidity trap as tech stocks come under pressure.
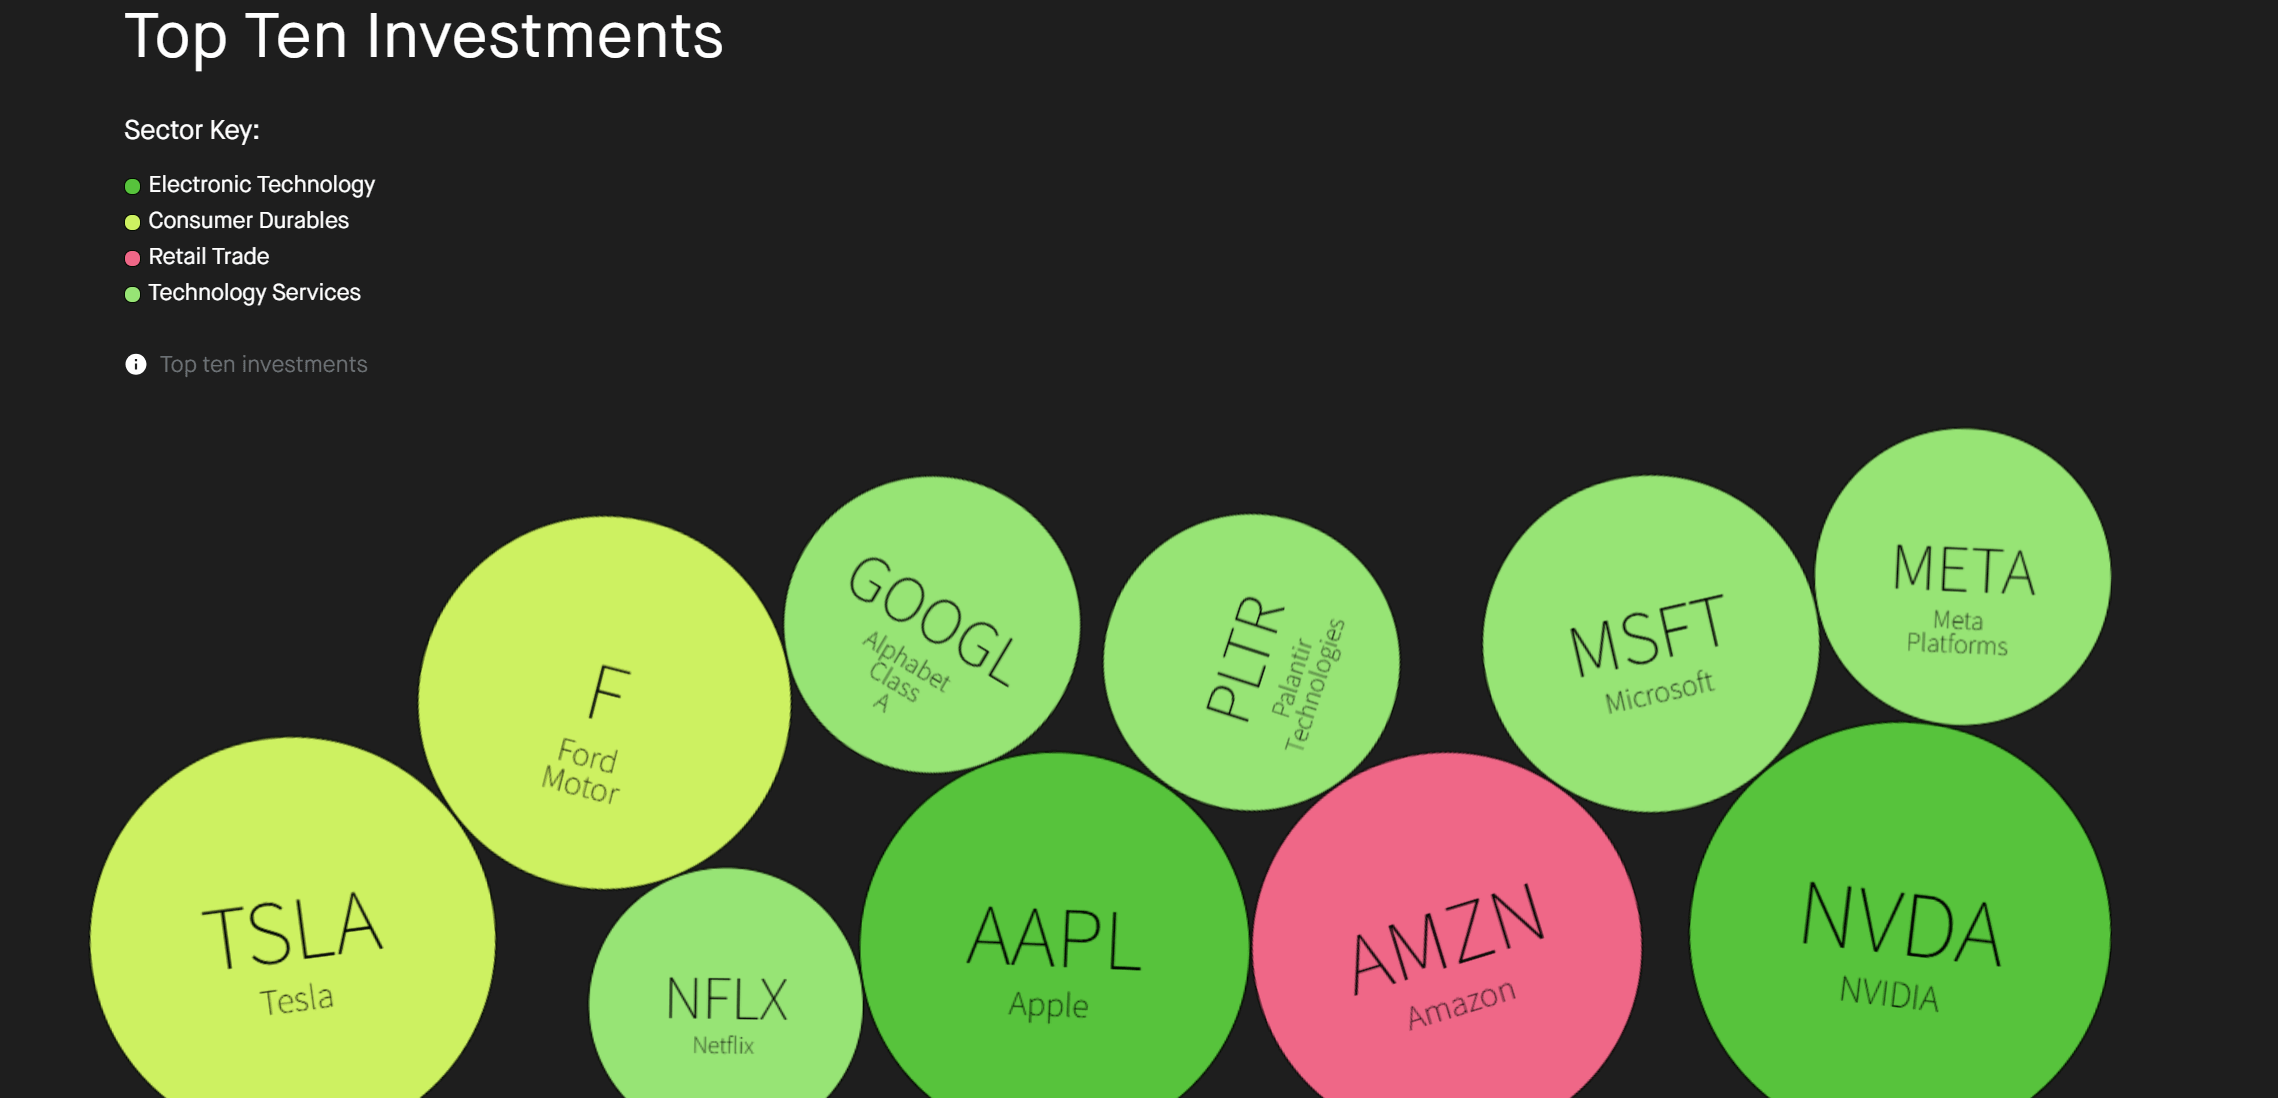
Source: Robinhood
Internal Disintegration and Valuation Premium Reshaping of the Magnificent Seven
The market's long-standing reliance on the "Magnificent Seven" to drive overall growth has officially ended. So far this year, the MAGS ETF, representing these seven companies, has significantly underperformed the broader market, with a cumulative decline of over 10%. This slump has persisted for nearly five months since October of the previous year. In contrast, the remaining 493 stocks in the S&P 500 (referenced by the XMAG ETF) have remained largely flat. This significant divergence stems from a breakdown in the internal correlation among the Magnificent Seven.
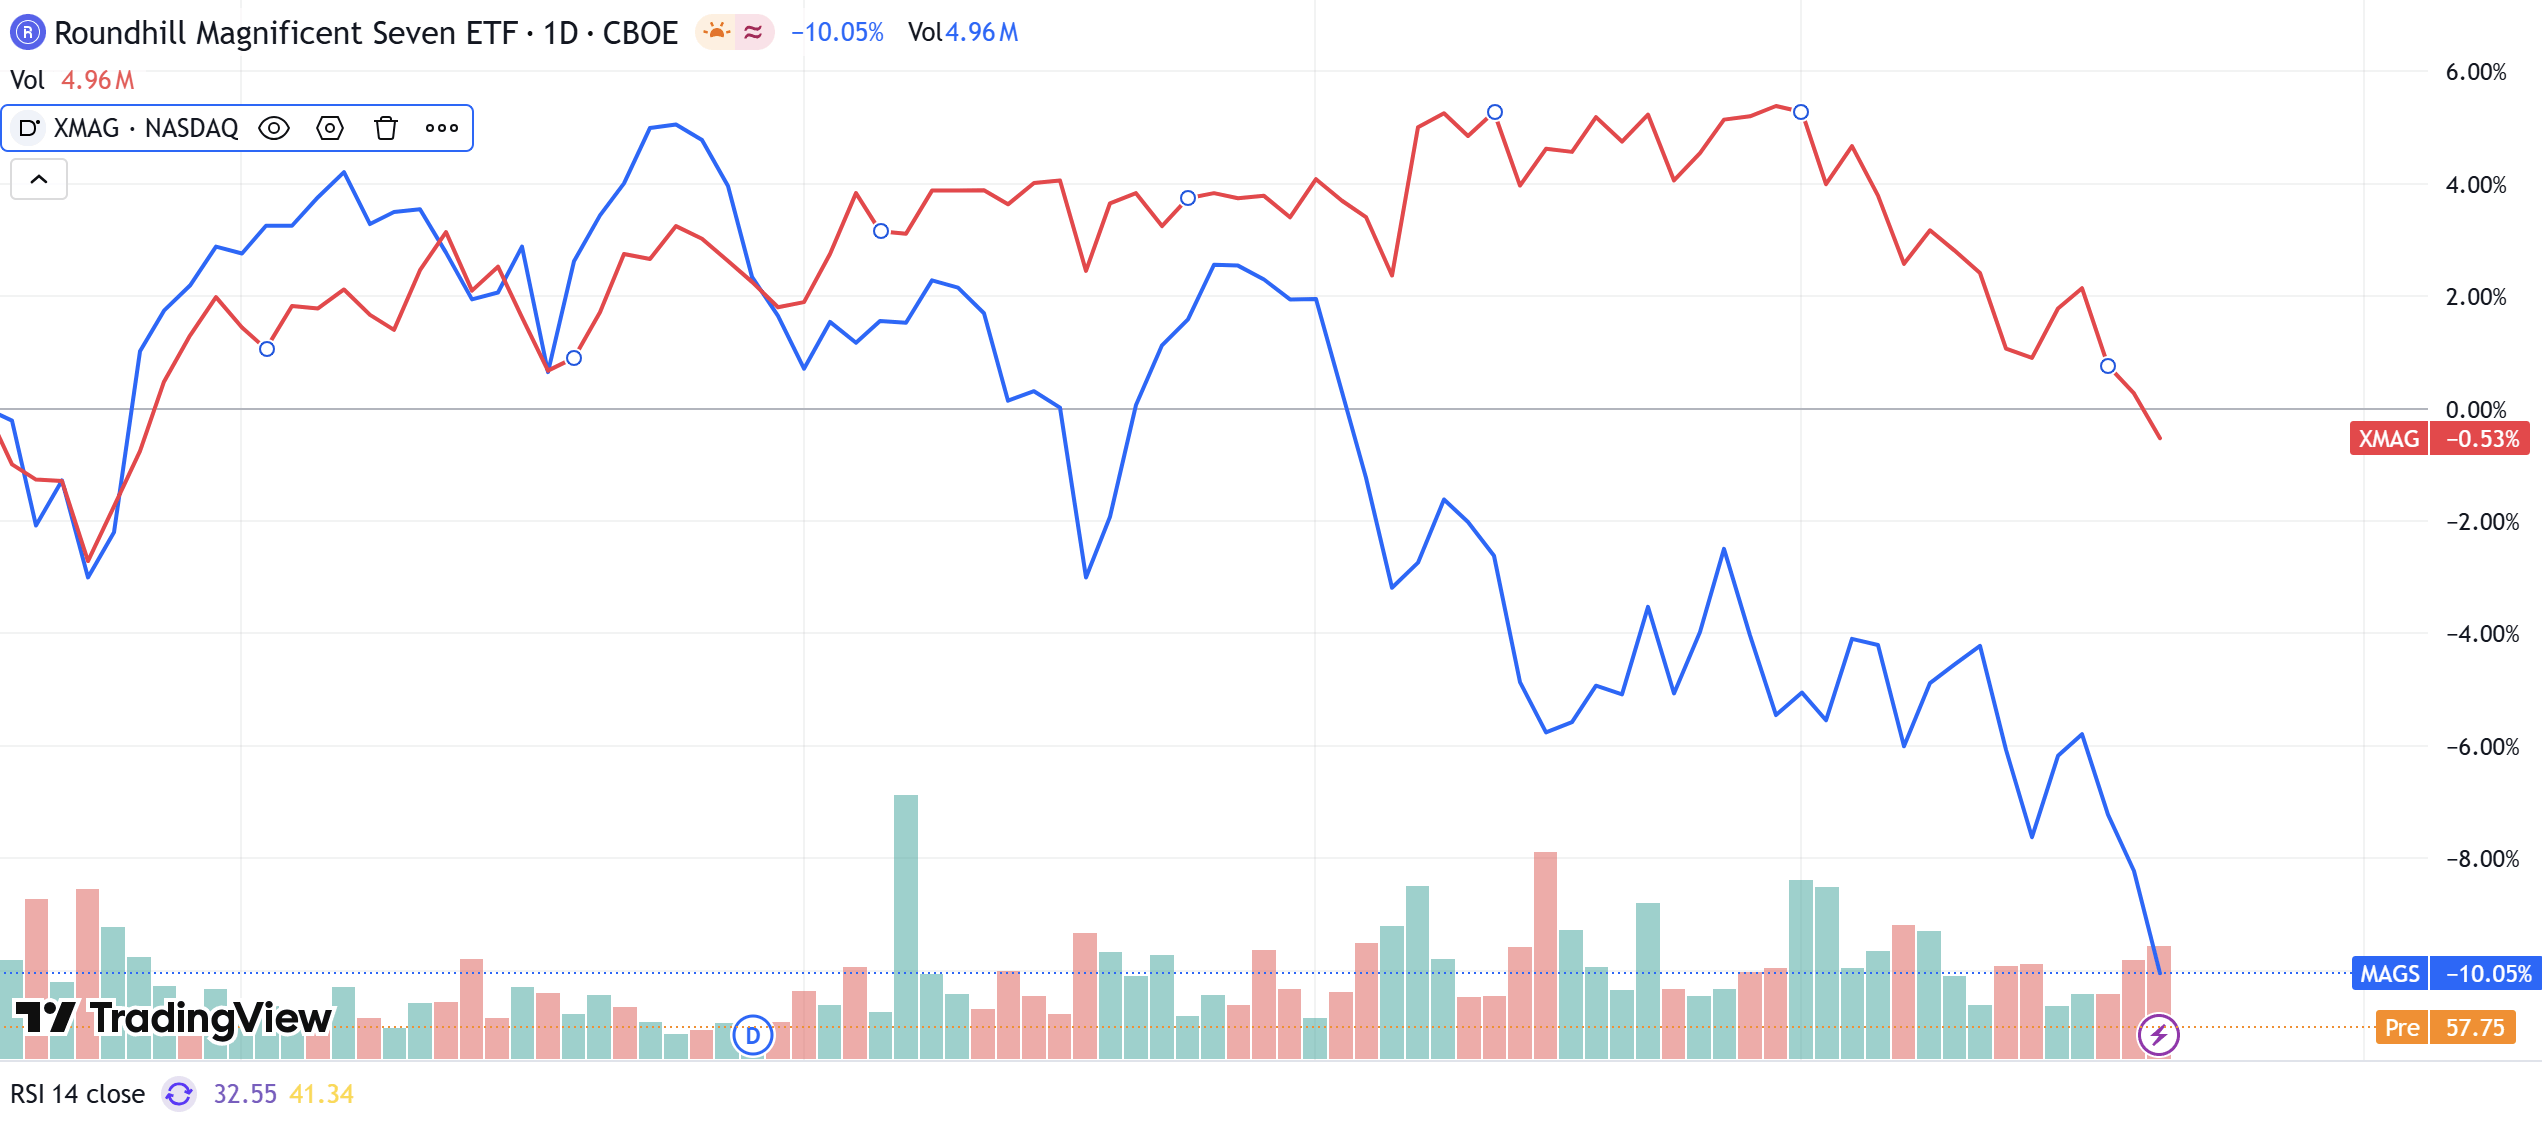
Source: TradingView
Data shows that the internal differentiation among these seven companies has reached a historic high of 52.3%. Year-to-date, NVIDIA and Google have managed to maintain relatively stable trends, but Microsoft, Amazon, and Apple have gradually become heavy weights dragging down the index. Tesla, in particular, has seen its stock performance completely decouple from tech indices under the dual pressures of intensifying EV competition and FSD (Full Self-Driving) commercialization failing to meet expectations.
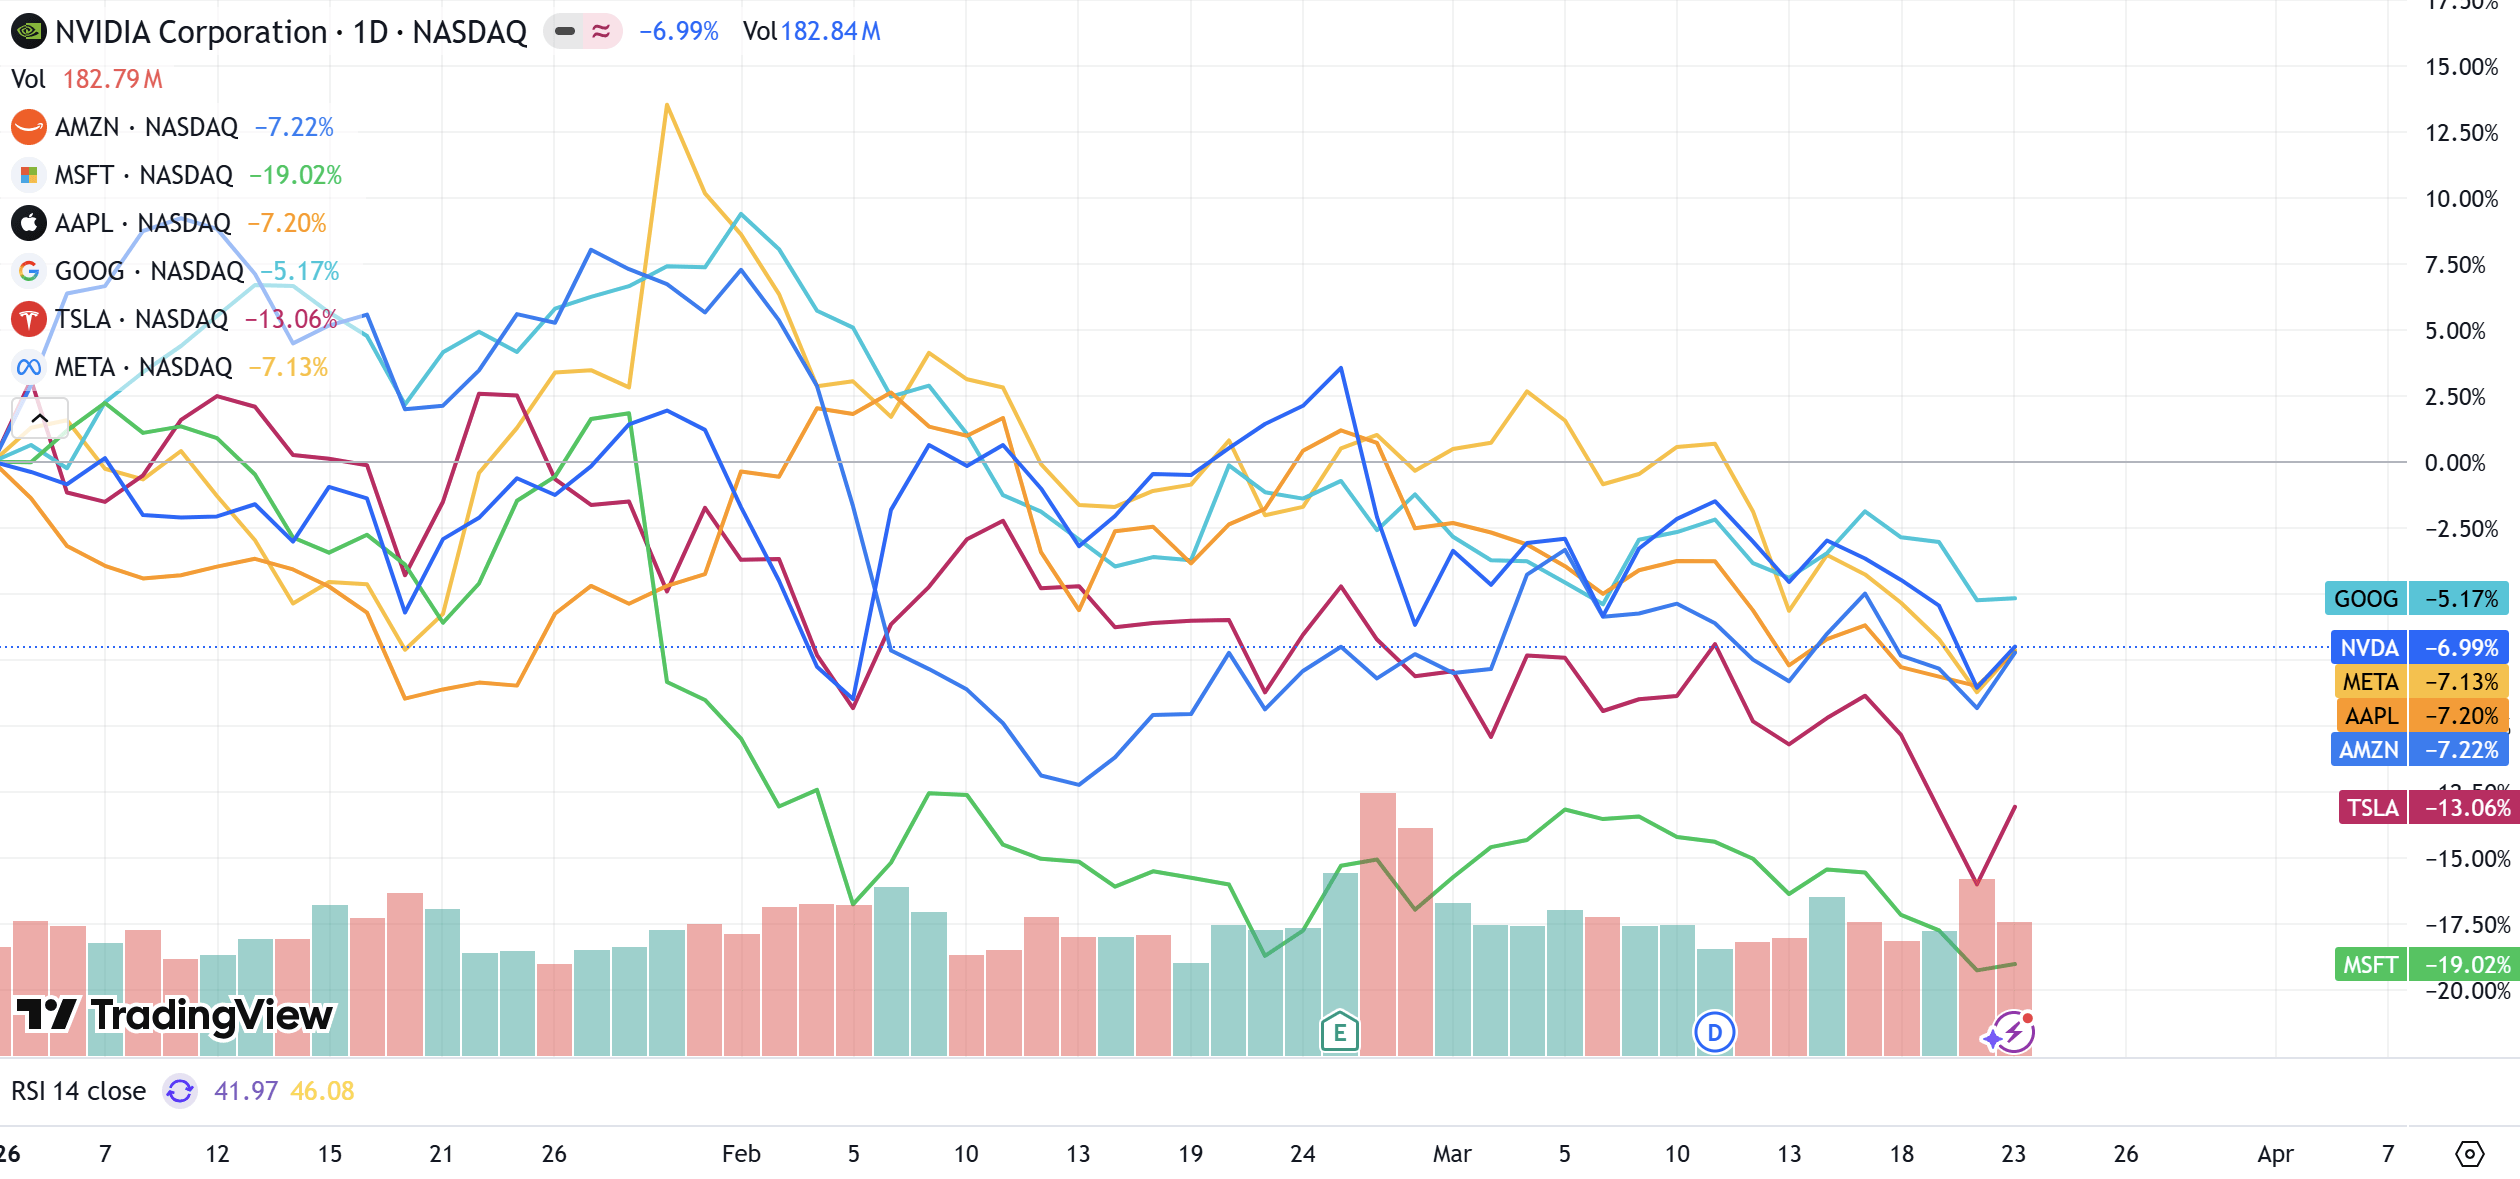
Source: TradingView
From a fundamental financial analysis, the core rationale supporting high valuations for Big Tech—"earnings growth far outstripping the market"—is vanishing. In the past, the market was willing to pay a premium because the earnings growth of the Magnificent Seven was often four to five times that of other companies. However, according to the latest earnings forecasts from FactSet, growth expectations for the Magnificent Seven in 2026 are only 24%, while growth expectations for the remaining 493 companies have risen to 12%. When this gap narrows to about two times, capital markets will inevitably re-evaluate the rationality of the premium. Institutional investors are no longer blindly believing in the AI narrative, turning instead to rigorous questioning of the return on investment (ROI) on these companies' massive capital expenditures.
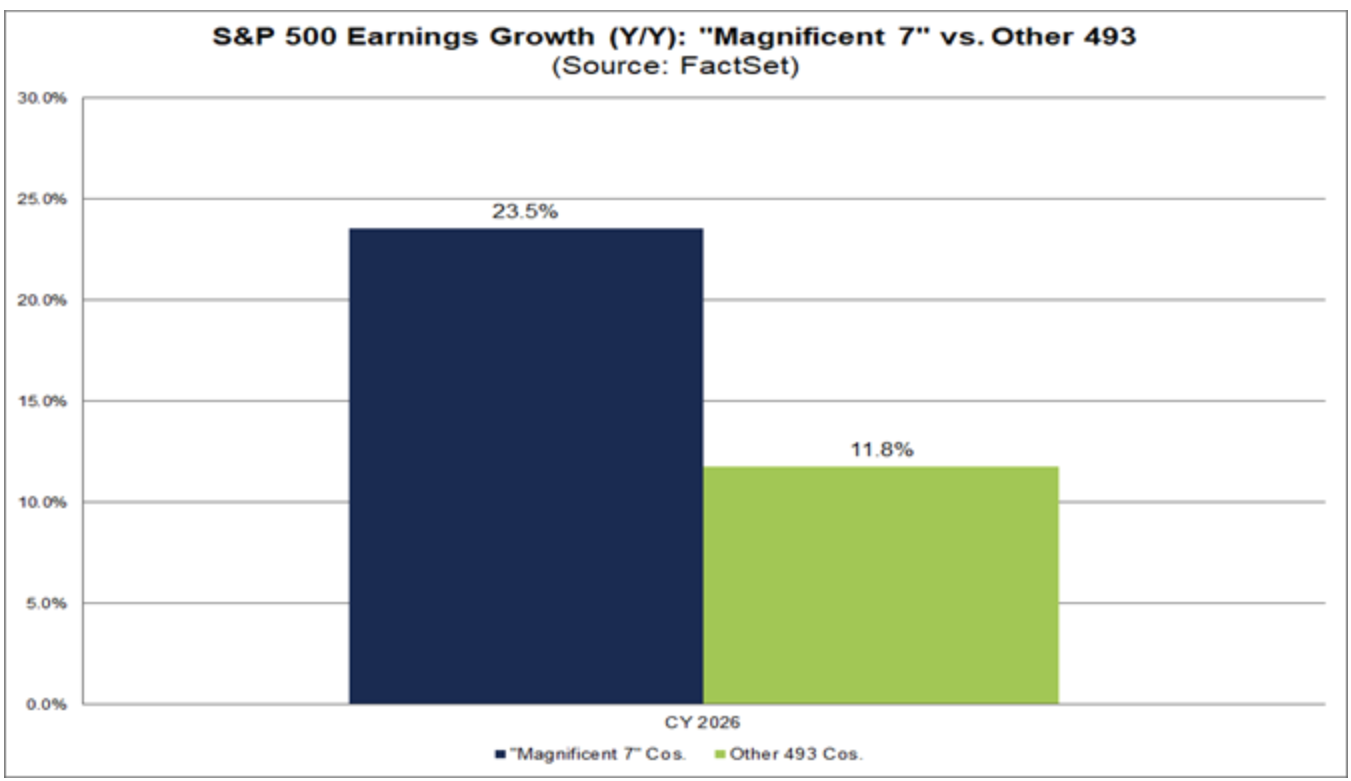
Source: FactSet
Note: The MAGS ETF cited in this article uses an equal-weighted calculation method, reflecting the average performance of the seven member companies, while FactSet's earnings forecasts are based on market-cap weighted aggregation, which is heavily influenced by top high-market-cap stocks. This statistical difference further confirms the structural divergence within the Magnificent Seven: that is, the growth of a few top companies masks the weakening fundamentals of some members.
AI Infrastructure Arms Race and the Test of Capital Expenditure Conversion Rates
In 2026, the "cash-burning war" in the AI sector reached an unprecedented fever pitch. Data from Bloomberg indicates that the capital expenditures of the four major cloud service providers—Amazon, Google, Microsoft, and Meta—on AI infrastructure are expected to exceed $650 billion, a 60% year-over-year increase from $410 billion in 2025. Among them, Amazon's estimated spending reached $200 billion, while Google remained high at $180 billion. Investment on this scale is equivalent to top-tier global infrastructure projects, even exceeding the annual GDP of some countries.
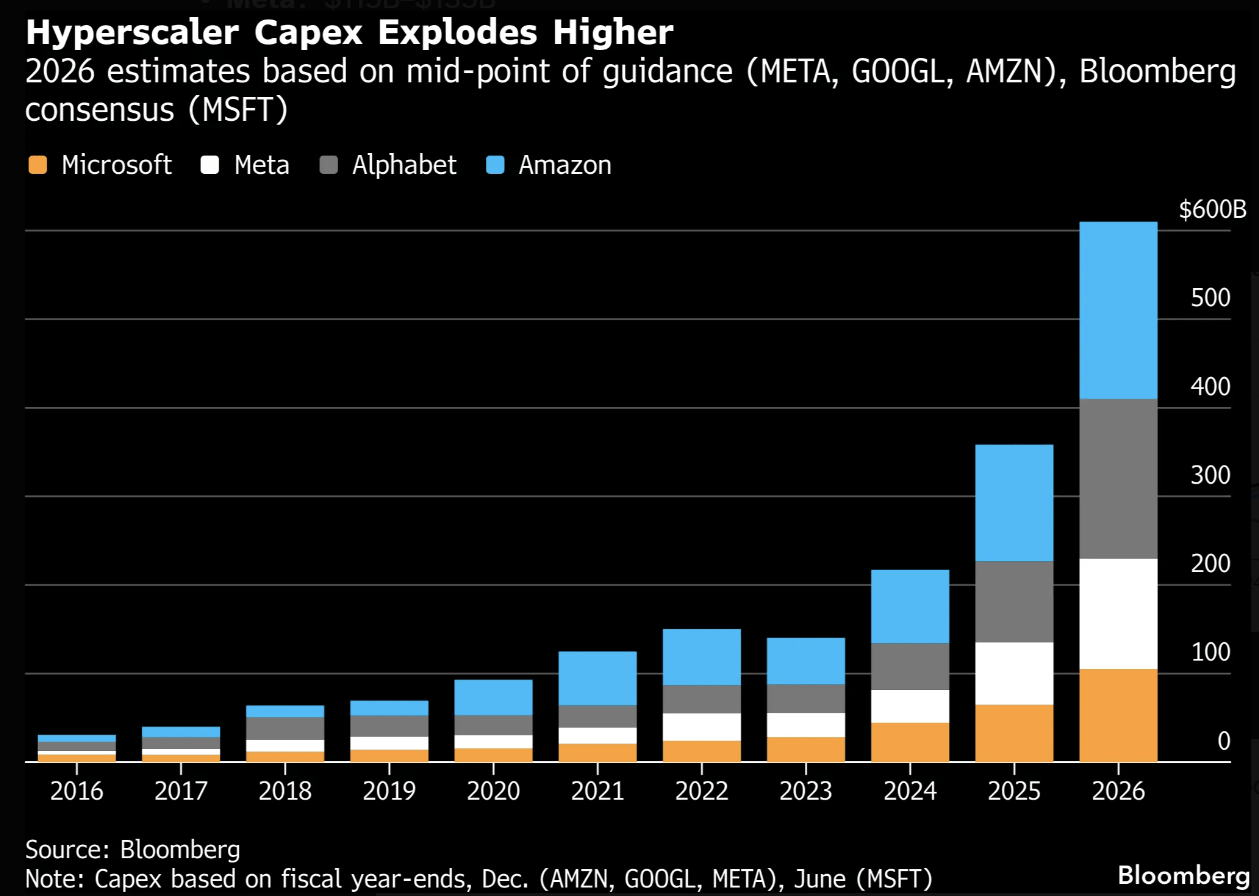
Source: Bloomberg
The shift in market attitude has been particularly evident during earnings season. Taking Microsoft as an example, despite continued growth in performance, its stock price suffered a double-digit decline because its AI input-output ratio did not meet the market's rigorous expectations. This marks the end of the "AI premium" era as the market enters the "AI proof" era. Capital is beginning to withdraw from overvalued tech peaks, flowing instead into "HALO assets" (High-asset, Asset-heavy, Low-obsolescence industries) with physical asset moats.
Traditional Industry Counterattack: Structural Rise of Energy and Industrial Sectors
While tech stocks have hit bottom-tier performance, traditional industries have demonstrated astonishing resilience and explosive power. According to data from Yardeni Research, the energy sector has risen by 33% year-to-date, in sharp contrast to the negative growth in the information technology sector. The logic behind this "traditional industry counterattack" is solid: on one hand, there is the catch-up demand for energy stocks after a long period of suppressed valuations; on the other hand, there is the restructuring of global energy supply chains caused by geopolitical conflicts. In addition to energy, consumer staples and industrial sectors grew by 5.5% and 5.2%, respectively.
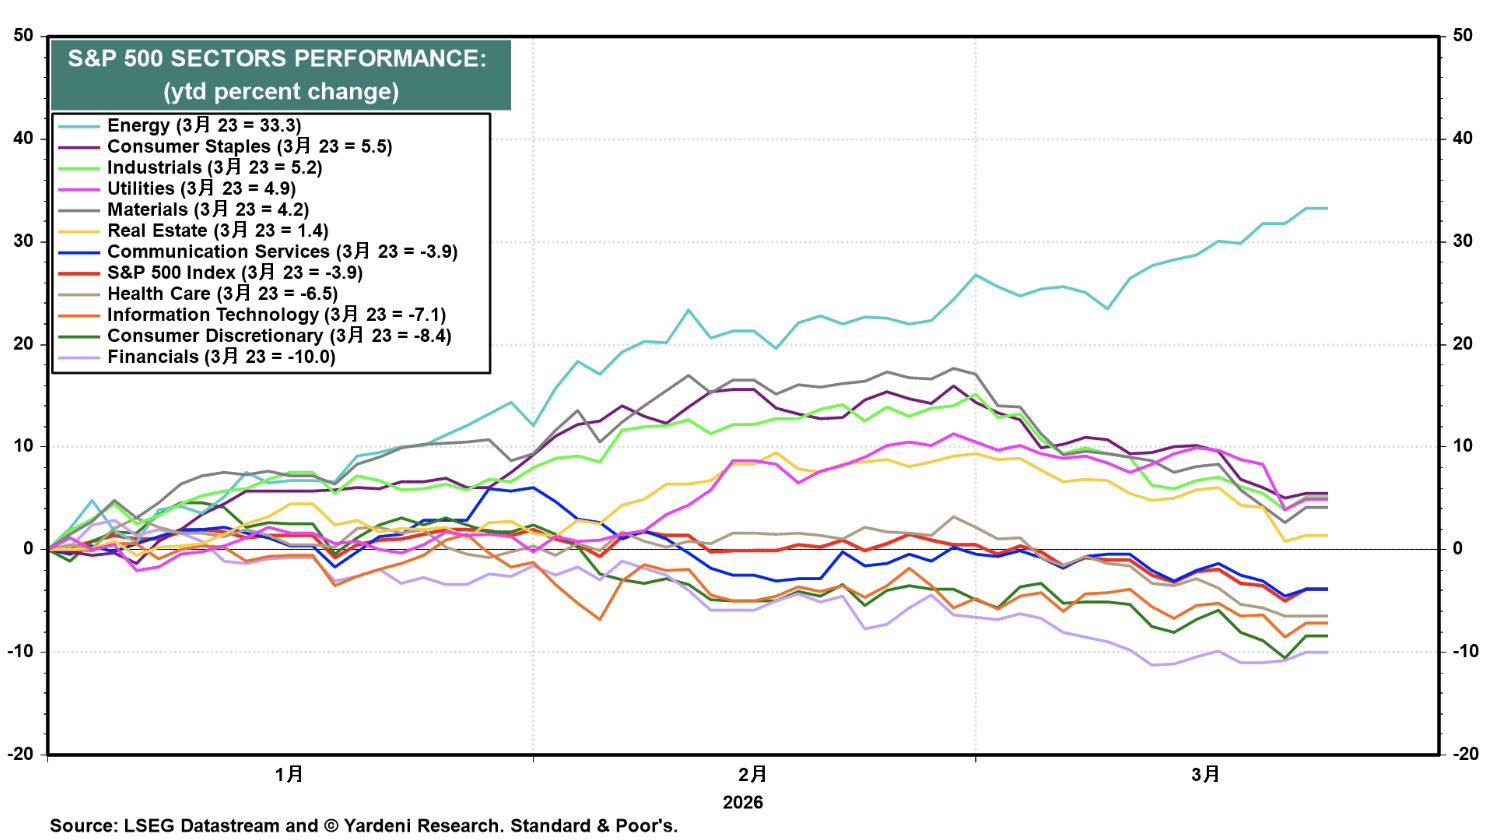
Source: Yardeni
This phenomenon has been further confirmed by the equal-weighted index (RSP) and the small-cap index (IWM). When market-cap-weighted indices weaken due to the tech slump, RSP and IWM have been able to stay near break-even, meaning capital is diffusing from expensive top companies to the broad physical base. A consensus is forming in the market: the implementation of AI cannot happen without energy supply, cooling systems, and physical data centers. Therefore, power companies and heavy machinery sectors that provide "underlying support" have become new safe havens for capital.
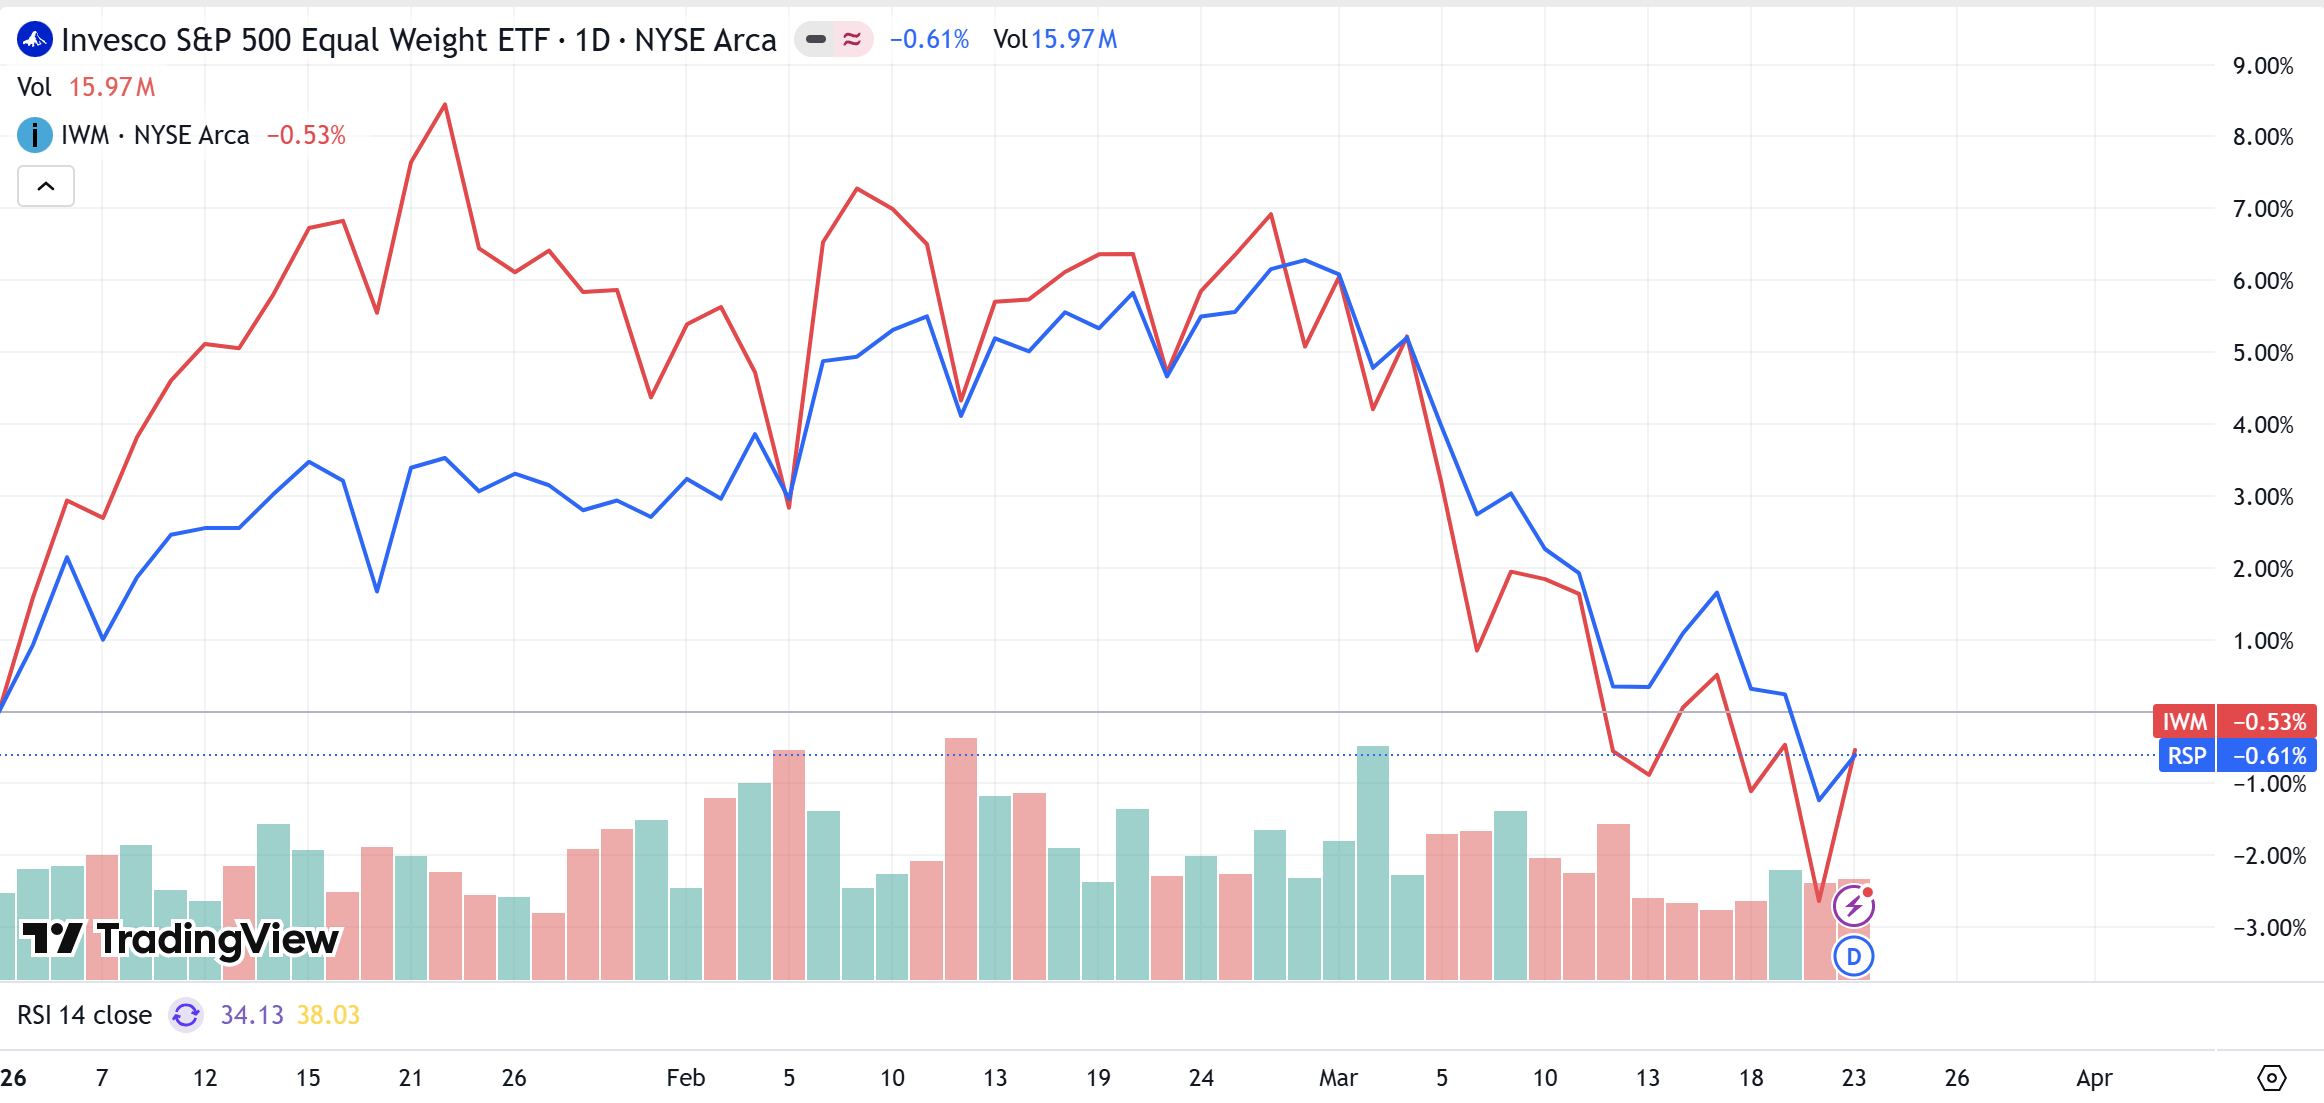
Source: TradingView
2026 Investment Allocation Strategy: From Concentrated Bets to Broad Defense
Faced with the current structural migration in the U.S. stock market, investors' survival logic must shift from "pursuing explosive growth" to "pursuing certainty." First, examining portfolio concentration is crucial. If tech stocks account for more than 80% of a portfolio, it faces an extremely high risk of drawdown. Second, psychological biases based on past success must be discarded, and core "lifeline indicators"—such as capital expenditure conversion rates—must be closely monitored. Tech stocks will only have the financial foundation to regain dominance when the AI investments of cloud giants can be manifested as revenue growth and the conversion rate widens the gap with costs again.
On a practical level, it is recommended that investors continuously monitor the relative strength of the equal-weighted RSP index versus the market-cap-weighted SPY index. The resilience shown by RSP is usually a signal of improving market breadth and a healthier structure. In the market environment of 2026, opportunities are no longer limited to a few tech geniuses but are widely distributed across physical industries such as energy, finance, and high-end manufacturing. Maintaining portfolio flexibility and hedging against valuation corrections in Big Tech through moderate diversification is a pragmatic way to navigate the current complex market environment.
Recommended Articles


