


Ripple Price Forecast: XRP recovery outlook dims amid fading demand
- XRP remains largely in bearish hands despite reclaiming the immediate $1.10 support.
- Institutional investors pull back amid muted XRP spot ETF activity and a marginal increase in futures Open Interest.
- XRP trades within a dominant short-term bearish outlook largely defined by declining major moving averages.
Ripple (XRP) maintains narrow range trading on Monday, with support at $1.10. The token's upside remains largely constrained, as major moving averages trend downward, aligning with low demand in both the institutional and retail markets.
XRP cooling demand limits momentum
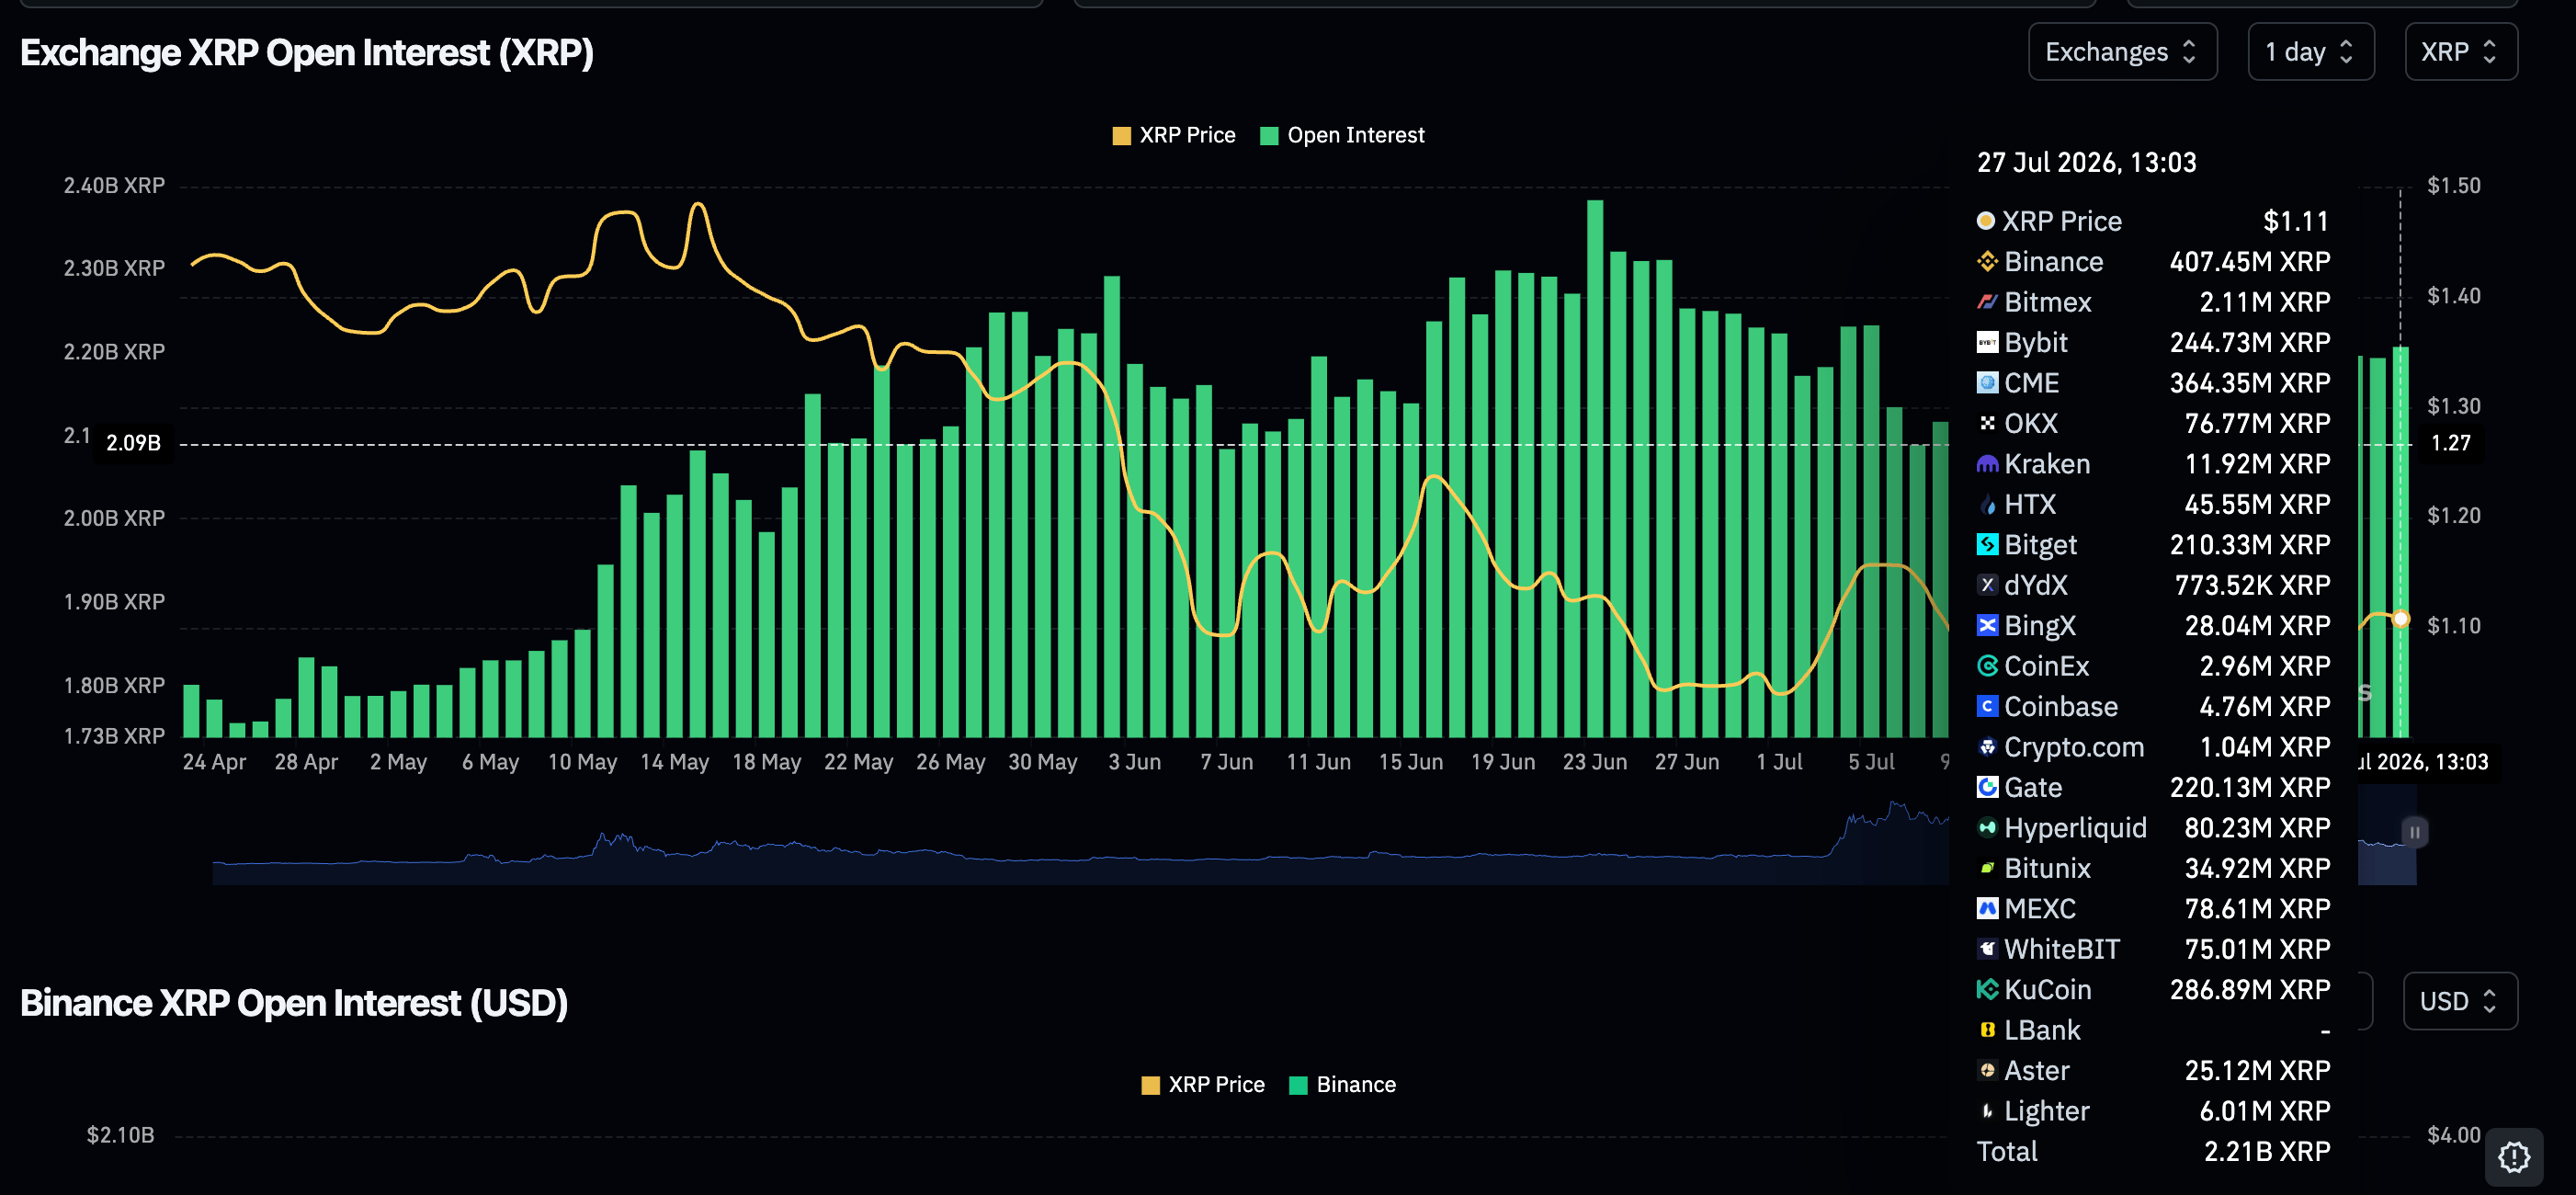
Retail interest in XRP derivatives remains relatively stable, given perpetual futures Open Interest (OI) stands at 2.21 billion XRP on Monday, up from 2.19 billion XRP the previous day. According to CoinGlass, OI has stabilized following the drop to 2.37 billion XRP on July 20, indicating that investors lack the conviction to remain exposed to risk. Besides, an attempt to sustain a breakout lost momentum around $1.16 last Tuesday.
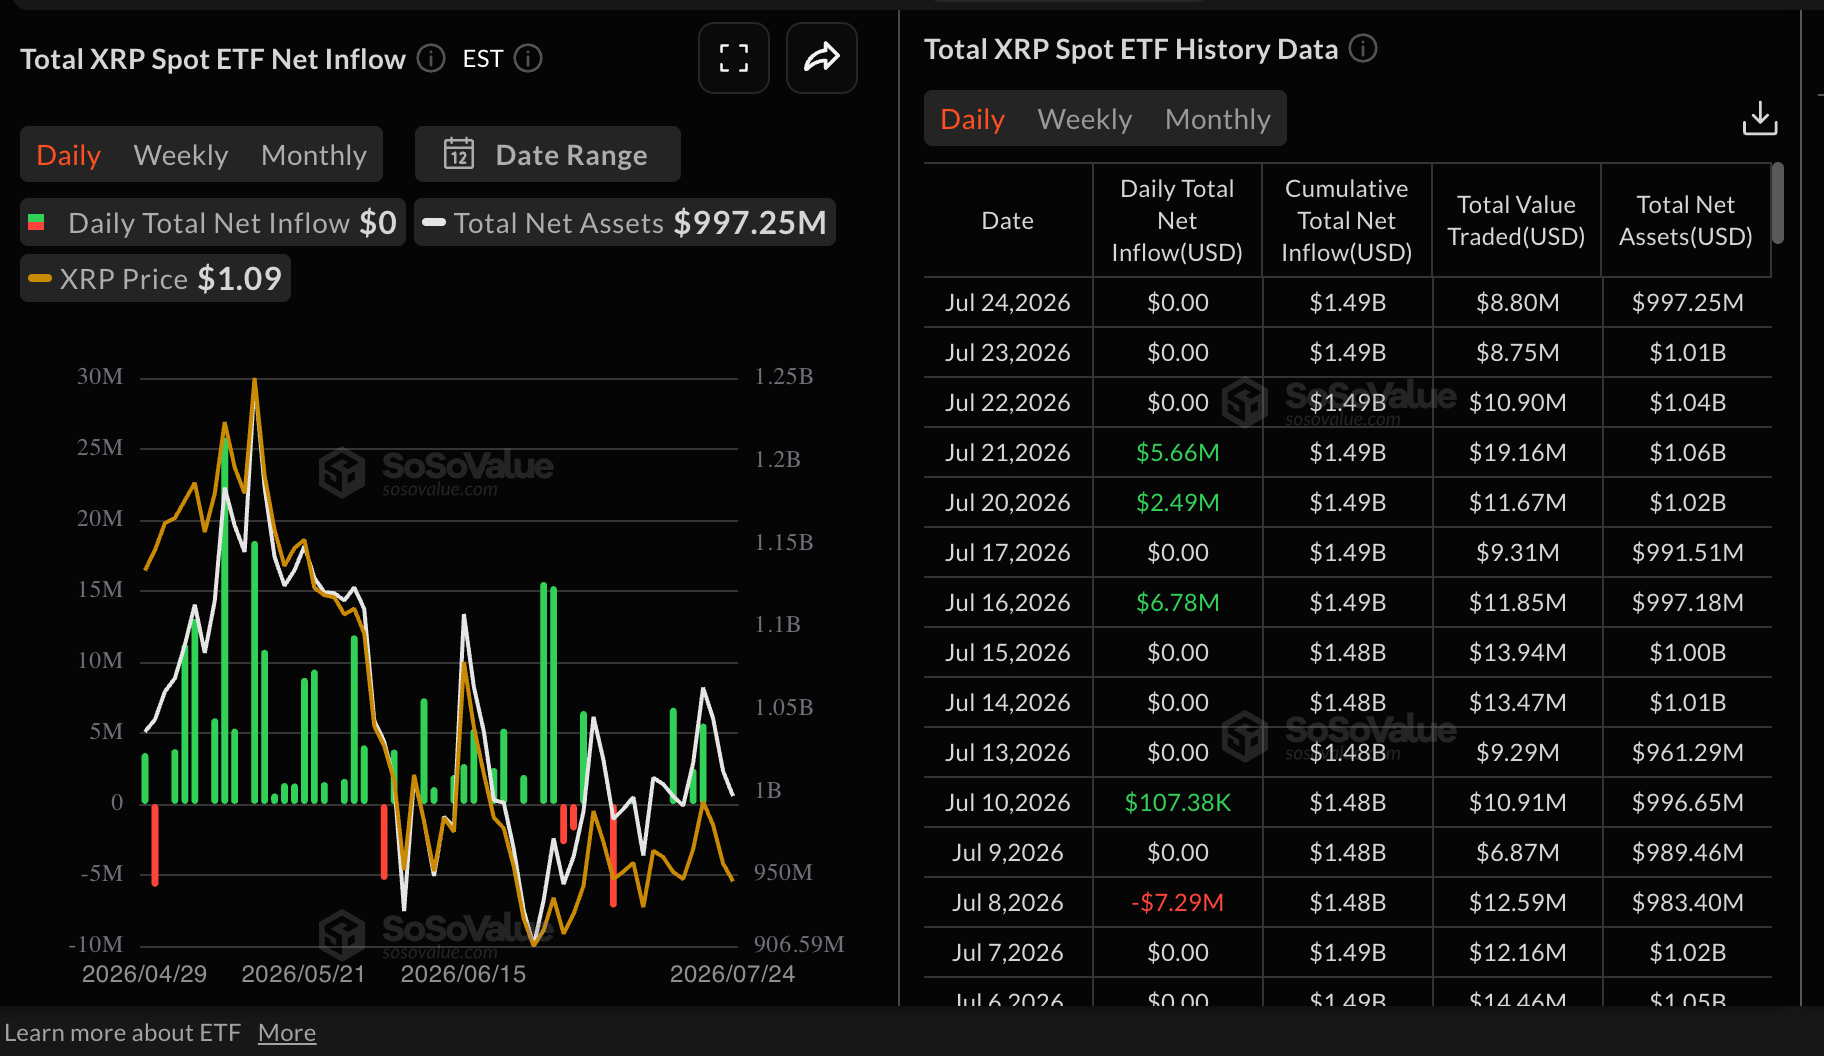
Appetite for XRP spot Exchange-Traded Funds (ETFs) continued to deteriorate, considering activity remained muted on Wednesday, Thursday and Friday. According to SoSoValue data, cumulative inflows average $1.49 billion, with net assets under management at $1.01 billion, suggesting that investors have a longer-term interest in XRP, which may help stabilize the price amid the current technical weight.
Geopolitical tensions in the Middle East eased over the weekend as United States (US) President Donald Trump paused military action against Iran to give space for dialogue. Iran also responded by suspending strikes on US military bases in the region. Oil prices have seen a sharp decline on Monday, reflecting easing tensions between the two countries as they seek a diplomatic solution toward a lasting peace agreement.
Price analysis: XRP extends consolidation
XRP trades at $1.11, keeping a bearish near-term bias as it holds well below the 50-day, 100-day and 200-day Exponential Moving Averages (EMAs). The nearest confluence of resistance sits just overhead around $1.14, where the 50-day EMA aligns with the 78.6% Fibonacci retracement level, suggesting that rebounds are likely to face supply quickly.
The Relative Strength Index (RSI) at 49 is effectively neutral on the daily chart, while the Moving Average Convergence Divergence (MACD) line remains marginally above zero, hinting that downside pressure is present but not yet accompanied by strong momentum.
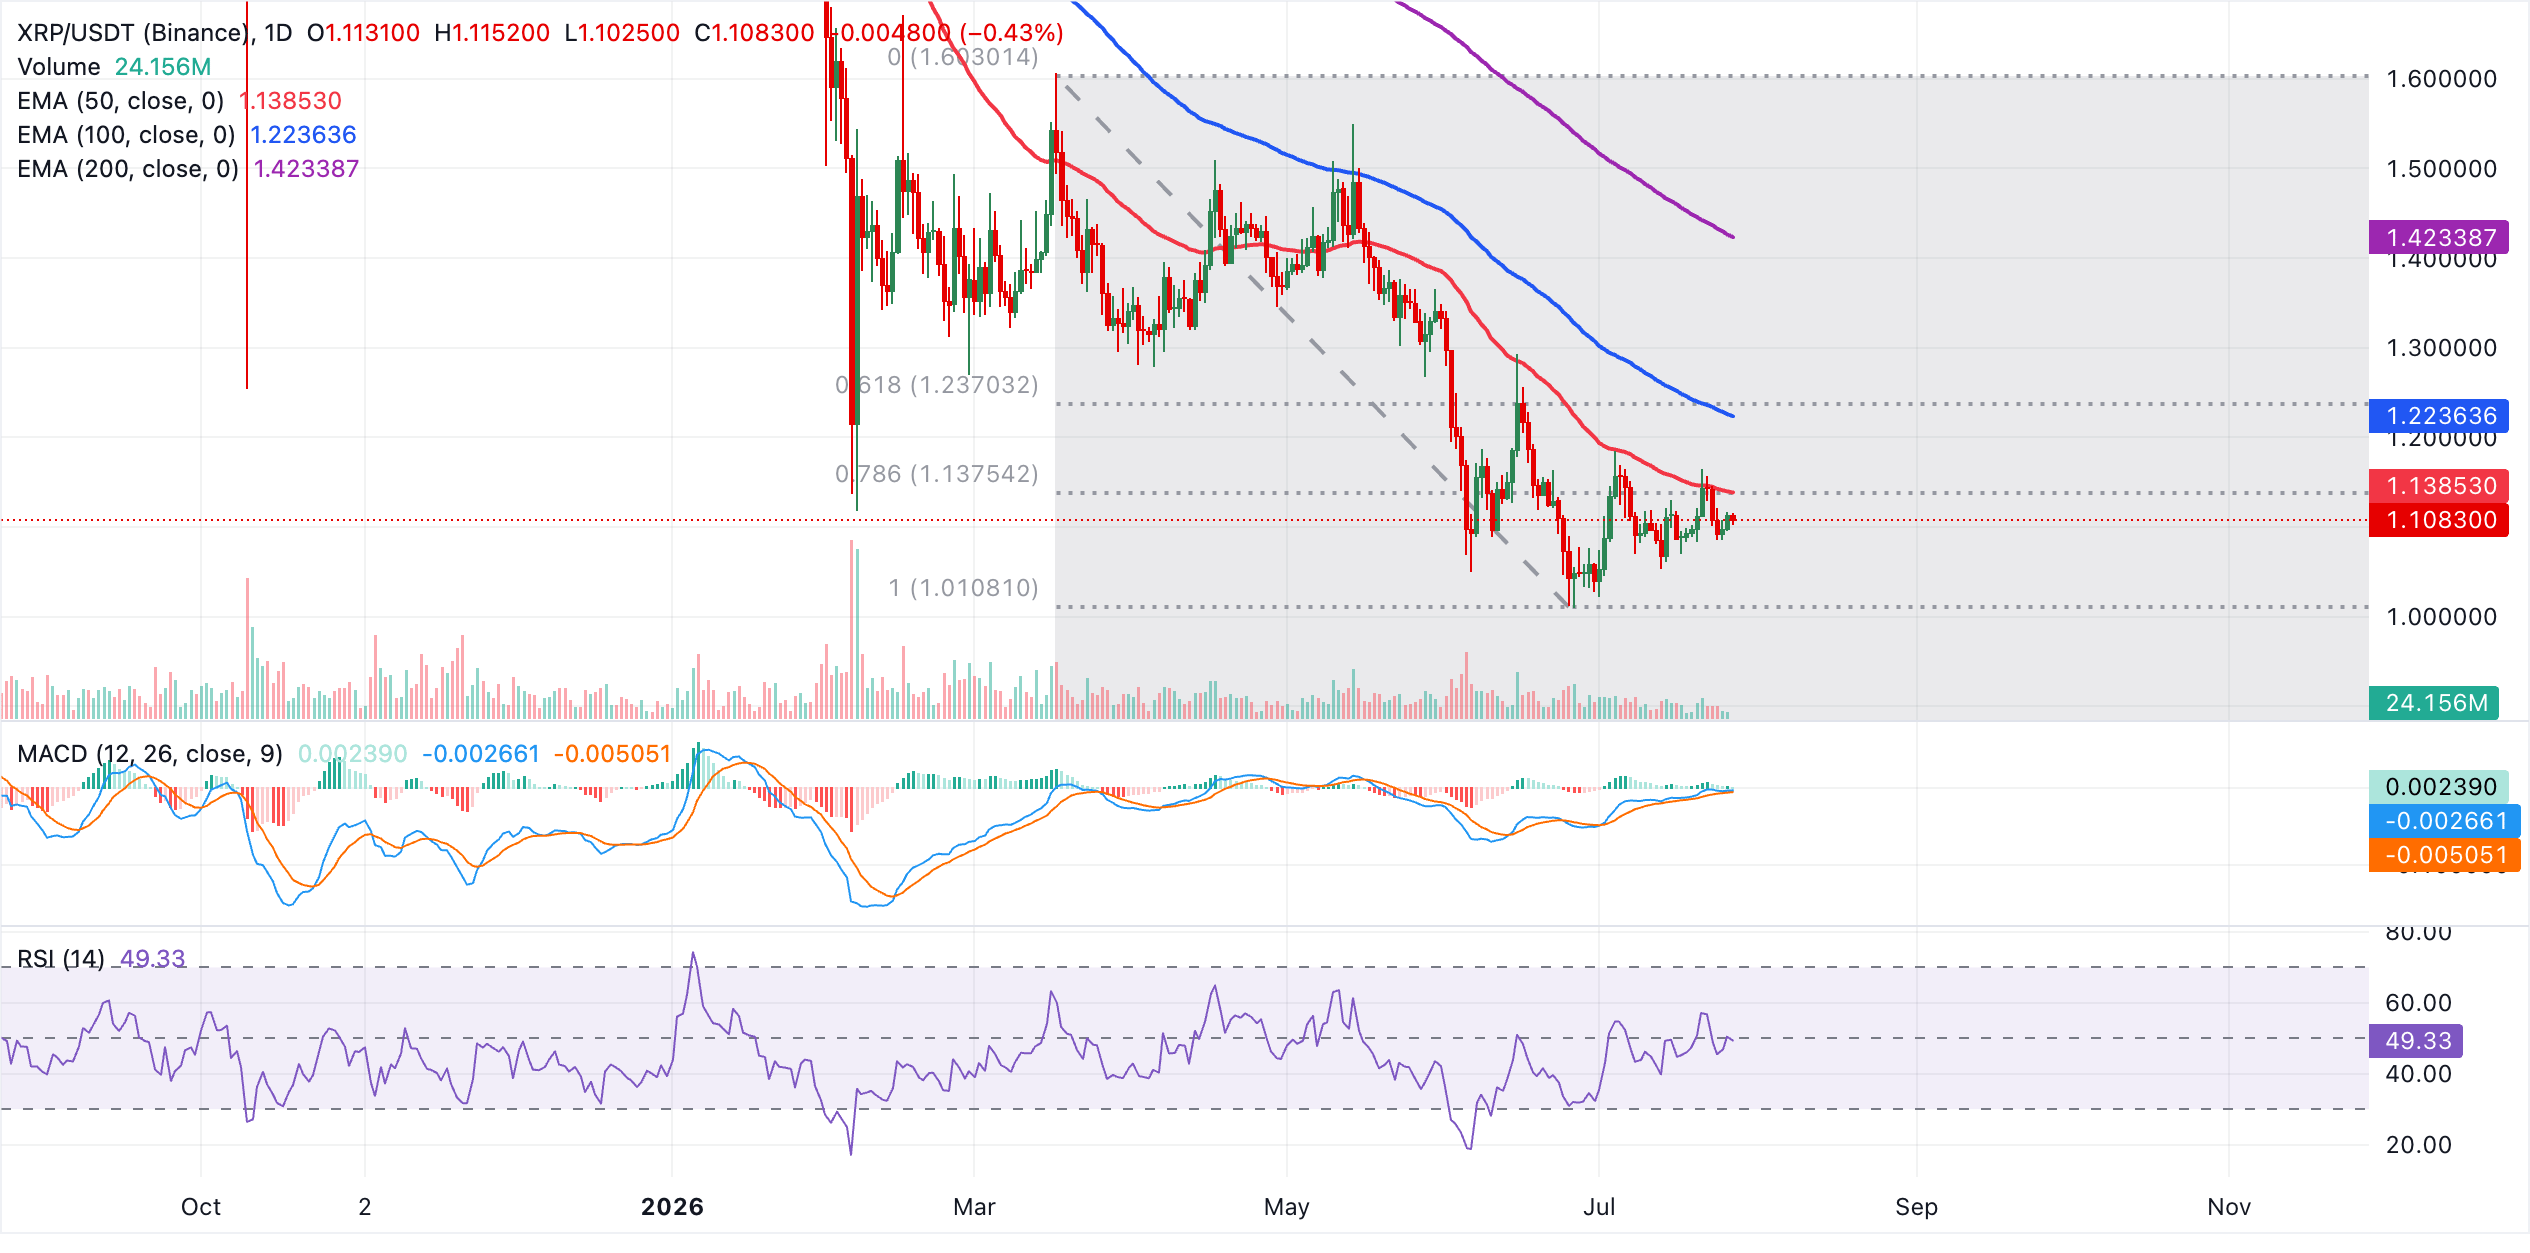
The first notable support emerges at the 100% Fibonacci retracement level near $1.01, where buyers may attempt to build a base if selling resumes. If price fails to hold this floor, the broader Fibonacci structure would leave XRP exposed to a deeper retracement toward prior cycle levels, reinforcing the view that the pair must reclaim the $1.14 cluster to ease immediate downside risks and open the way toward the 100-day EMA at $1.22 and the 61.8% Fibonacci retracement at $1.24.
(The technical analysis of this story was written with the help of an AI tool. Know more.)
Crypto ETF FAQs
An Exchange-Traded Fund (ETF) is an investment vehicle or an index that tracks the price of an underlying asset. ETFs can not only track a single asset, but a group of assets and sectors. For example, a Bitcoin ETF tracks Bitcoin’s price. ETF is a tool used by investors to gain exposure to a certain asset.
Yes. The first Bitcoin futures ETF in the US was approved by the US Securities & Exchange Commission in October 2021. A total of seven Bitcoin futures ETFs have been approved, with more than 20 still waiting for the regulator’s permission. The SEC says that the cryptocurrency industry is new and subject to manipulation, which is why it has been delaying crypto-related futures ETFs for the last few years.
Yes. The SEC approved in January 2024 the listing and trading of several Bitcoin spot Exchange-Traded Funds, opening the door to institutional capital and mainstream investors to trade the main crypto currency. The decision was hailed by the industry as a game changer.
The main advantage of crypto ETFs is the possibility of gaining exposure to a cryptocurrency without ownership, reducing the risk and cost of holding the asset. Other pros are a lower learning curve and higher security for investors since ETFs take charge of securing the underlying asset holdings. As for the main drawbacks, the main one is that as an investor you can’t have direct ownership of the asset, or, as they say in crypto, “not your keys, not your coins.” Other disadvantages are higher costs associated with holding crypto since ETFs charge fees for active management. Finally, even though investing in ETFs reduces the risk of holding an asset, price swings in the underlying cryptocurrency are likely to be reflected in the investment vehicle too.
Recommended Articles


