

Bitcoin (BTCUSD) Is down 1.24% on Sep 15: Why It Happened

Source Tradingkey

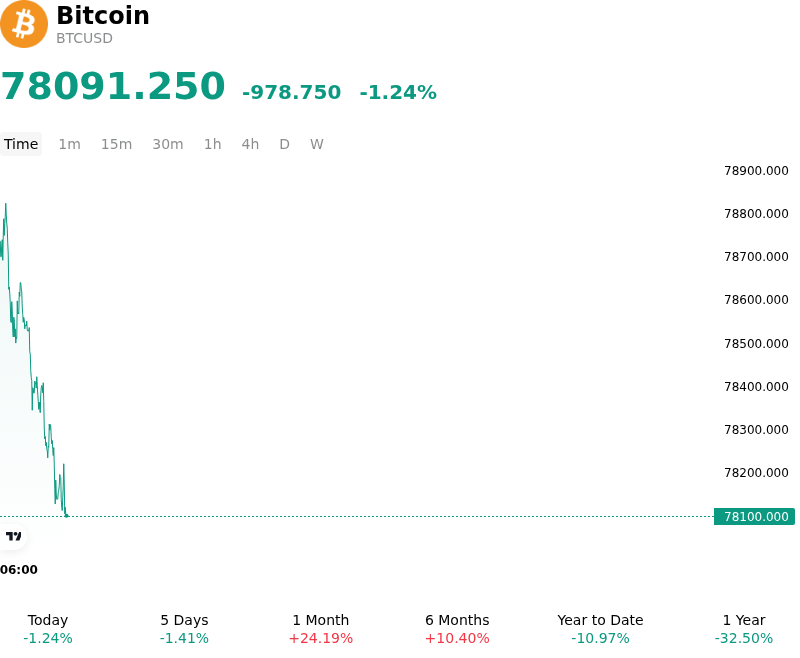
Bitcoin (BTCUSD) is down 1.24% at Sep 15 20:15(ET), now at $78091.25, with a 7-day down of 0.47%.
SummaryOverview

What is driving Bitcoin (BTCUSD)’s stock price down today?

Rising benchmark Treasury yields and pre-FOMC de-risking prompted institutional market participants to reduce risk exposure across digital assets. With the Federal Open Market Committee commencing its policy meeting, macro traders adjusted portfolios to reflect heightened monetary uncertainty and potential policy hawkishness. Persistent yield pressures elevated the opportunity cost of holding non-yielding digital assets, driving selective capital preservation and spot market distribution among institutional desks.

The downward pressure was accentuated by a cooling in spot Bitcoin ETF capital flows, where recent net outflows signaled a temporary pause in institutional buying momentum. Portfolio managers elected to realize profits and curb directional leverage rather than absorb downside exposure ahead of the central bank's rate trajectory and economic projections. On-chain metrics corroborated this defensive posture, displaying a drop in active wallet accumulation rates and an uptick in stablecoin cash reserves as funds waited on the sidelines for greater macro clarity.

Simultaneously, regulatory event risk introduced additional friction as market participants digested legislative developments surrounding U.S. digital asset market structure rules in Congress. Uncertainty regarding key Senate procedural outcomes led derivatives traders to unwind leveraged long positions and increase protective put positioning in options markets. This reduction in futures open interest, paired with thinning order-book liquidity, created an environment where modest sell flows drove a broader re-pricing across spot exchanges.

While short-term price action reflects macro policy anxiety, liquidity adjustments, and regulatory positioning, the underlying institutional framework for digital assets remains intact. Market participants continue to monitor global liquidity conditions, real interest rate trajectories, and potential legislative breakthroughs for signs of renewed capital deployment. Near-term price discovery will likely remain sensitive to central bank forward guidance and spot ETF flow dynamics.

Technical Analysis of Bitcoin (BTCUSD)

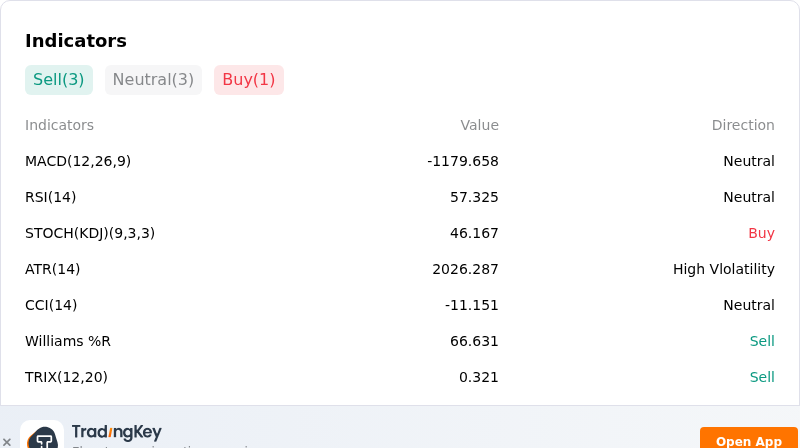
Technically, Bitcoin (BTCUSD) shows a MACD (12,26,9) value of -1179.658, indicating a neutral signal. The RSI at 57.325 suggests neutral condition and the Williams %R at 66.631 suggests sell condition. Please monitor closely.
IndicatorAnalysis

More details about Bitcoin (BTCUSD)

Recent Events and Risks:

  • Federal Reserve Rate-Hike Bets and Macro Hawkishness: Hotter-than-expected producer price index data and strong employment metrics have elevated market expectations of a Federal Reserve interest rate hike at the September 15–16 FOMC meeting to nearly 70%. Surging U.S. Treasury yields have amplified risk-off sentiment across global capital markets, placing persistent downward pressure on Bitcoin as capital rotates into cash and yields.
  • Derivatives Leverage Unwind and Long Liquidations: A sudden market breakdown below $78,000 triggered hundreds of millions of dollars in crypto futures liquidations—heavily dominated by forced long position closures—accelerating downside momentum and pushing prices toward critical support in the $76,000–$77,000 band.
  • Institutional Spot ETF Outflow Reversal: U.S. spot Bitcoin exchange-traded funds recorded consecutive daily net outflows totaling over $167 million across major issuers, including BlackRock's IBIT and ARKB, signaling a temporary pullback in Wall Street spot market absorption.
  • Overhead Supply Resistance and Support Fragility: Persistent profit-taking and distribution by long-term holders in the $78,000–$82,000 price channel have established a heavy resistance ceiling, increasing technical vulnerability to a breakdown toward the $75,000 support area and the 200-day moving average near $72,500.
Disclaimer: For information purposes only. Past performance is not indicative of future results.
placeholder
US dollar clings to nine-week lows near 98.4 as Brent nears $100 and the yen hits a seven-month high — five events to watch todayThe dollar is pinned near nine-week lows even after a blockbuster jobs report, as an oil spike toward $100, a surging yen and China's reflation data crowd the driver's seat. Five key events to watch today: Brent at $99.46, USD/JPY at 154, China CPI/PPI, PBOC gold buying, and Thursday's PPI / Friday's CPI ahead of the September 15-16 FOMC.
Author  Eric Nkando
Sep 09, Wed
The dollar is pinned near nine-week lows even after a blockbuster jobs report, as an oil spike toward $100, a surging yen and China's reflation data crowd the driver's seat. Five key events to watch today: Brent at $99.46, USD/JPY at 154, China CPI/PPI, PBOC gold buying, and Thursday's PPI / Friday's CPI ahead of the September 15-16 FOMC.
placeholder
US August CPI lands tonight: after a 5.4% PPI shock, will the Fed hike on September 16?US August PPI came in at 5.4% year-on-year, above the 5.3% consensus, with core PPI at 4.6%. Traders have pushed the odds of a 25bp Fed hike on September 15-16 to around 70%. Tonight's CPI is the last major inflation print before the decision — here is the full calendar, the consensus numbers, and what a hot versus cool reading would mean for the dollar, yields, gold and stocks.
Author  Irene Q.
Sep 11, Fri
US August PPI came in at 5.4% year-on-year, above the 5.3% consensus, with core PPI at 4.6%. Traders have pushed the odds of a 25bp Fed hike on September 15-16 to around 70%. Tonight's CPI is the last major inflation print before the decision — here is the full calendar, the consensus numbers, and what a hot versus cool reading would mean for the dollar, yields, gold and stocks.
placeholder
Brent tests $108 as a key export pipeline stays shut — can the rally clear $110?Brent crude rose 2.55% to $106.97 and WTI 2.32% to $102.30 as a major regional export pipeline remained offline with no restart timeline. Front-month backwardation has widened to $5.53 from $3.84 a week ago, European gas is at its highest since December 2022, and one analyst sees $119.48 if talks stall.
Author  Irene Q.
18 hours ago
Brent crude rose 2.55% to $106.97 and WTI 2.32% to $102.30 as a major regional export pipeline remained offline with no restart timeline. Front-month backwardation has widened to $5.53 from $3.84 a week ago, European gas is at its highest since December 2022, and one analyst sees $119.48 if talks stall.
placeholder
Fed hike odds near 90% into Wednesday's decision — how to trade the dollar, gold and the S&P 500A 0.3% monthly core CPI print has lifted the market-implied probability of a 25bp Fed hike on 16 September to roughly 86.5% ~ 90%, which would be the first increase since July 2023. Here is the decision timeline, the pricing versus the forecasts, both scenarios, and the key levels for the dollar, gold and the S&P 500.
Author  Suzie
17 hours ago
A 0.3% monthly core CPI print has lifted the market-implied probability of a 25bp Fed hike on 16 September to roughly 86.5% ~ 90%, which would be the first increase since July 2023. Here is the decision timeline, the pricing versus the forecasts, both scenarios, and the key levels for the dollar, gold and the S&P 500.
placeholder
Silver Price Forecast: XAG/USD falls to near $63.50 amid Fed hike bets, higher oil pricesSilver price (XAG/USD) loses its gains from the previous day, trading around $63.50 per troy ounce during Asian hours on Monday. Non-yielding Silver is currently facing significant headwinds driven by rising Federal Reserve (Fed) rate-hike expectations for the upcoming September decision.
Author  FXStreet
15 hours ago
Silver price (XAG/USD) loses its gains from the previous day, trading around $63.50 per troy ounce during Asian hours on Monday. Non-yielding Silver is currently facing significant headwinds driven by rising Federal Reserve (Fed) rate-hike expectations for the upcoming September decision.
goTop
quote