


United States Dollar Index rises to near 99.85 ahead of US ADP Employment data
- The US Dollar Index jumps to a fresh two-week high at 99.85 amid surging US Treasury Yields.
- Higher oil prices due to Middle East conflicts have revived global inflation fears.
- Investors await the US ADP Employment Change data for August.
The US Dollar (USD) reflects strength against its currency peers on Wednesday as United States bond yields surge further due to rising oil prices and hawkish Federal Reserve (Fed) expectations.
In European trade, the US Dollar Index (DXY), which gauges the Greenback’s value against six major currencies, trades 0.2% higher to near 99.86. 10-year US Treasury Yields hit a fresh high at 4.82%, the highest level seen since November 2023.
US Dollar Price Today
The table below shows the percentage change of US Dollar (USD) against listed major currencies today. US Dollar was the strongest against the New Zealand Dollar.
| USD | EUR | GBP | JPY | CAD | AUD | NZD | CHF | |
|---|---|---|---|---|---|---|---|---|
| USD | 0.17% | 0.24% | -0.21% | 0.24% | 0.14% | 1.28% | 0.44% | |
| EUR | -0.17% | 0.05% | -0.35% | 0.06% | -0.02% | 1.07% | 0.27% | |
| GBP | -0.24% | -0.05% | -0.43% | 0.00% | -0.09% | 0.99% | 0.21% | |
| JPY | 0.21% | 0.35% | 0.43% | 0.43% | 0.34% | 1.43% | 0.63% | |
| CAD | -0.24% | -0.06% | -0.00% | -0.43% | -0.09% | 1.00% | 0.21% | |
| AUD | -0.14% | 0.02% | 0.09% | -0.34% | 0.09% | 1.09% | 0.32% | |
| NZD | -1.28% | -1.07% | -0.99% | -1.43% | -1.00% | -1.09% | -0.78% | |
| CHF | -0.44% | -0.27% | -0.21% | -0.63% | -0.21% | -0.32% | 0.78% |
The heat map shows percentage changes of major currencies against each other. The base currency is picked from the left column, while the quote currency is picked from the top row. For example, if you pick the US Dollar from the left column and move along the horizontal line to the Japanese Yen, the percentage change displayed in the box will represent USD (base)/JPY (quote).
Middle East tensions revive inflation fears and bolster the Dollar
Analysts at OCBC said that the renewed escalation in the Middle East has brought “inflation risks back into focus”, driving a fresh rise in global bond yields. They note that this move has been “accompanied by a bearish flattening of the US yield curve, a stronger USD and lower gold prices as markets moved to fully price a 25bp Fed rate hike by October.”
OCBC adds that Fed Governor Michael Barr has reinforced the hawkish policy backdrop, stating that “further rate increases may be warranted if inflation fails to moderate,” comments that “build on Chair Warsh's hawkish message at Jackson Hole.”
The CME FedWatch tool shows a 67% chance that the Fed will hike interest rates in the policy meeting this month.
Meanwhile, investors await the US ADP Employment Change data for August, which will be published at 12:15 GMT. According to estimates, the US private sector created 48K fresh jobs, slightly higher than 44K in July.
This week, the major trigger for the US Dollar will be the Nonfarm Payrolls (NFP) data for August, which will be released on Friday.
US Dollar Index Technical Analysis
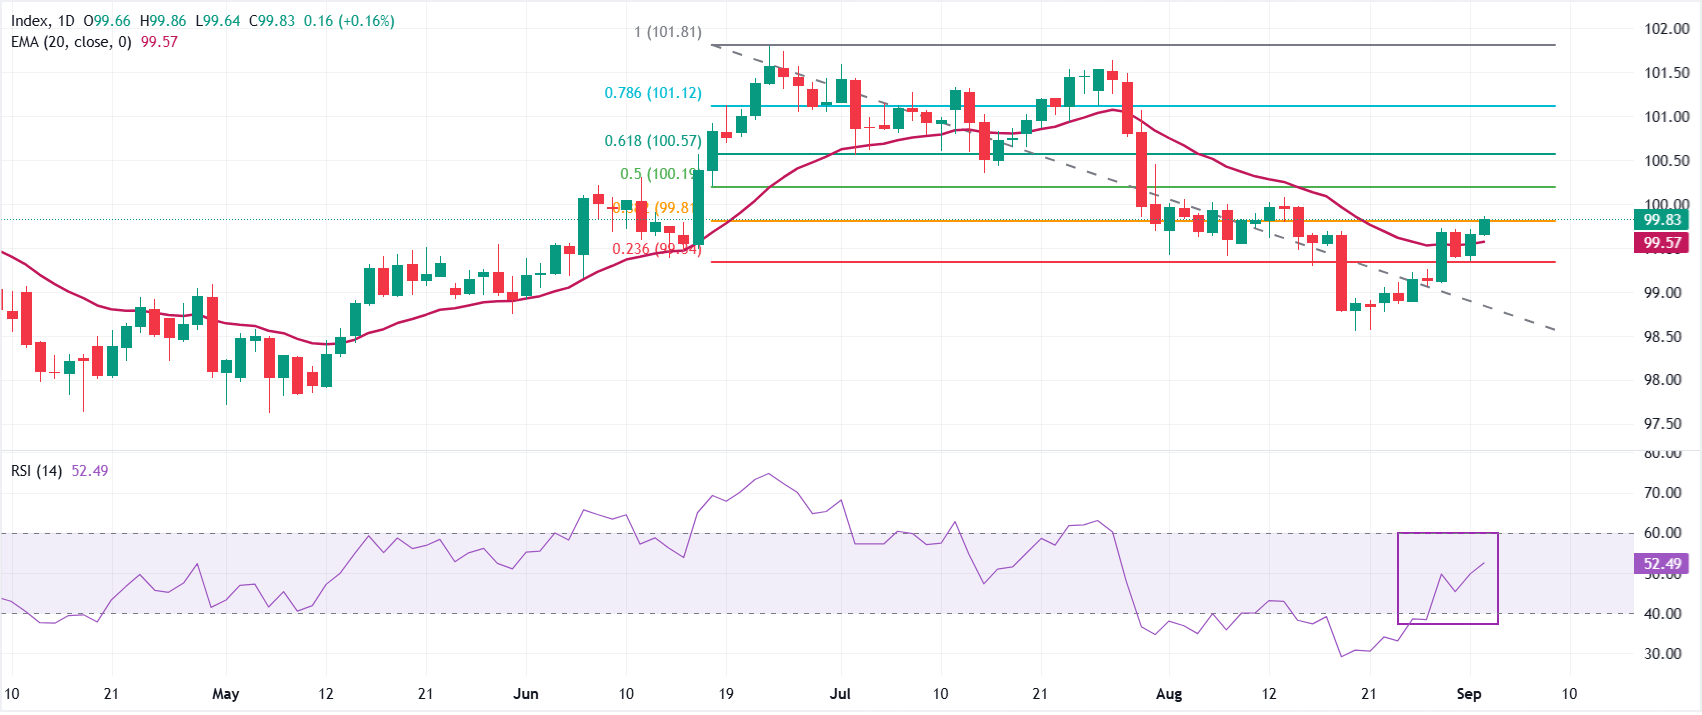
In the daily chart, the Dollar Index Spot trades at 99.83. The near-term tone favors a slight bullish trend, with price sitting close to the 38.2% Fibonacci retracement at 99.81 and above the 20-day exponential moving average (EMA) at 99.57.
The Relative Strength Index (RSI) at 52.49 has recovered toward the midline, hinting that downside momentum has faded but not yet shifted into a clear bullish impulse.
On the topside, initial resistance is seen at the 50% Fibonacci retracement at 100.19, followed by the 61.8% level at 100.57; a daily close above these barriers would open the way toward the 78.6% retracement at 101.12 and the recent swing high near the 100% level at 101.81. On the downside, immediate support aligns at the 38.2% retracement at 99.81, with the 20-day EMA at 99.57 and the 23.6% retracement at 99.34 acting as a broader demand area; a break below this zone would expose the deeper structural floor far below current prices.
(The technical analysis of this story was written with the help of an AI tool. Know more.)
Economic Indicator
ADP Employment Change
The ADP Employment Change is a gauge of employment in the private sector released by the largest payroll processor in the US, Automatic Data Processing Inc. It measures the change in the number of people privately employed in the US. Generally speaking, a rise in the indicator has positive implications for consumer spending and is stimulative of economic growth. So a high reading is traditionally seen as bullish for the US Dollar (USD), while a low reading is seen as bearish.
Read more.Next release: Wed Sep 02, 2026 12:15
Frequency: Monthly
Consensus: 47K
Previous: 44K
Source: ADP Research Institute
Traders often consider employment figures from ADP, America’s largest payrolls provider, report as the harbinger of the Bureau of Labor Statistics release on Nonfarm Payrolls (usually published two days later), because of the correlation between the two. The overlaying of both series is quite high, but on individual months, the discrepancy can be substantial. Another reason FX traders follow this report is the same as with the NFP – a persistent vigorous growth in employment figures increases inflationary pressures, and with it, the likelihood that the Fed will raise interest rates. Actual figures beating consensus tend to be USD bullish.
Recommended Articles


