

Dogecoin Price Forecast: Rebound gains traction as bulls target key resistance trendline

Source Fxstreet
  • Dogecoin holds steady above $0.0770 on Thursday, after a rebound of over 2% the previous day.
  • Declining DOGE Open Interest suggests reduced leveraged activity while institutional investors go silent for the third week.
  • The technical outlook for DOGE suggests a potential bullish breakout of a key resistance trendline on the four-hour chart.

Dogecoin (DOGE) shows signs of recovery, hovering above $0.0770 on Thursday after two consecutive days of gains. The meme coin gains traction despite muted appeal from institutional investors and declining Open Interest. The technical outlook for DOGE suggests an upside bias as the recovery gains traction, hinting at a potential bullish breakout of a key resistance trendline on the four-hour chart.

The appeal for DOGE is fading

Meme coins often lose their appeal among investors at the slightest hint of headwinds. Dogecoin, the original meme coin, faces similar challenges, with institutional and leverage-taking investors waiting on the sidelines. 

CoinGlass data shows that DOGE futures Open Interest (OI) is down to 13.62 billion DOGE from 14.52 billion on Monday, despite the rising spot price. This suggests positional unwinding as the traders are unwilling to take risks in DOGE. 
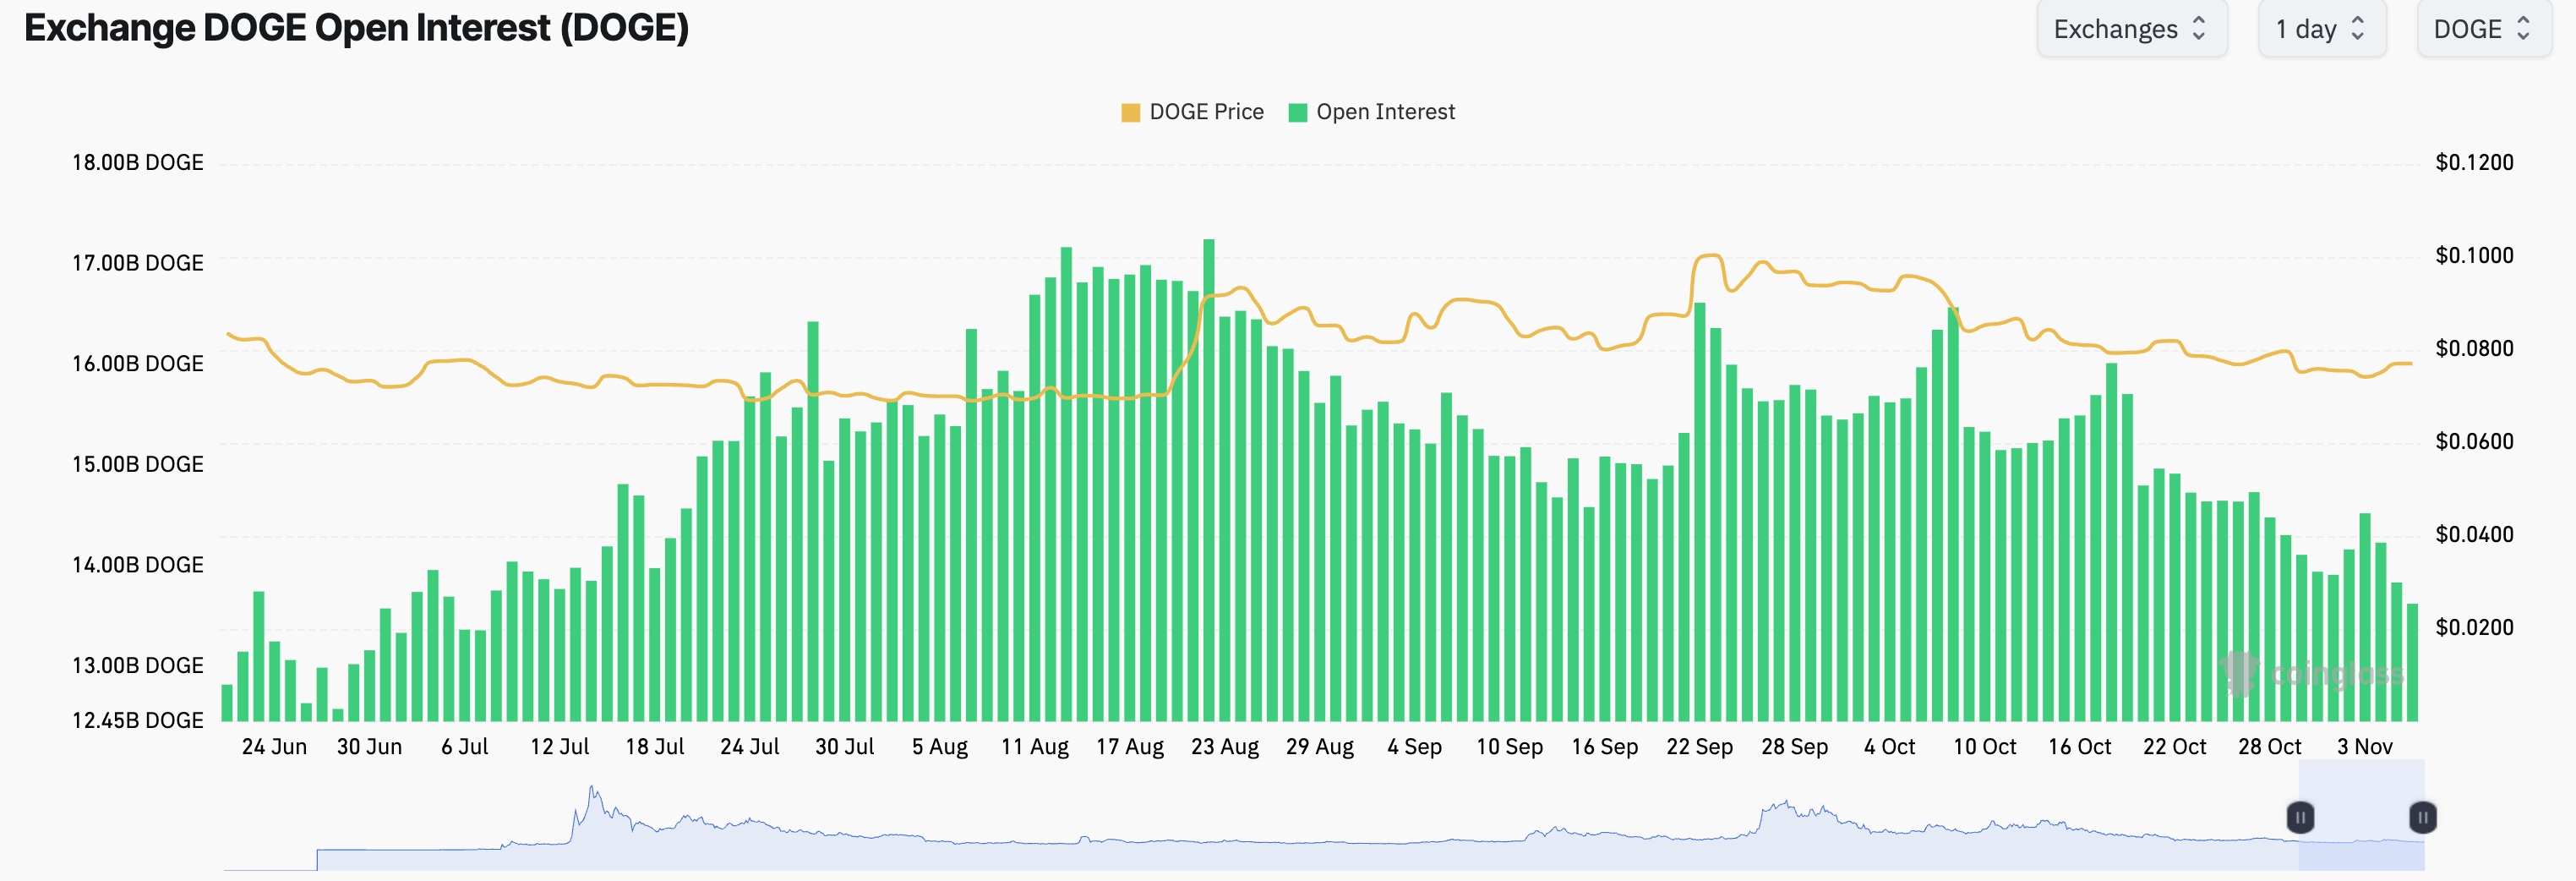
DOGE Open Interest chart. Source: CoinGlass

On the other hand, Dogecoin Exchange-Traded Funds (ETFs) have recorded zero inflows since October 14, stepping into their third muted week. This silence mirrors the similar subdued risk appetite from the derivatives market, despite the near-term recovery.
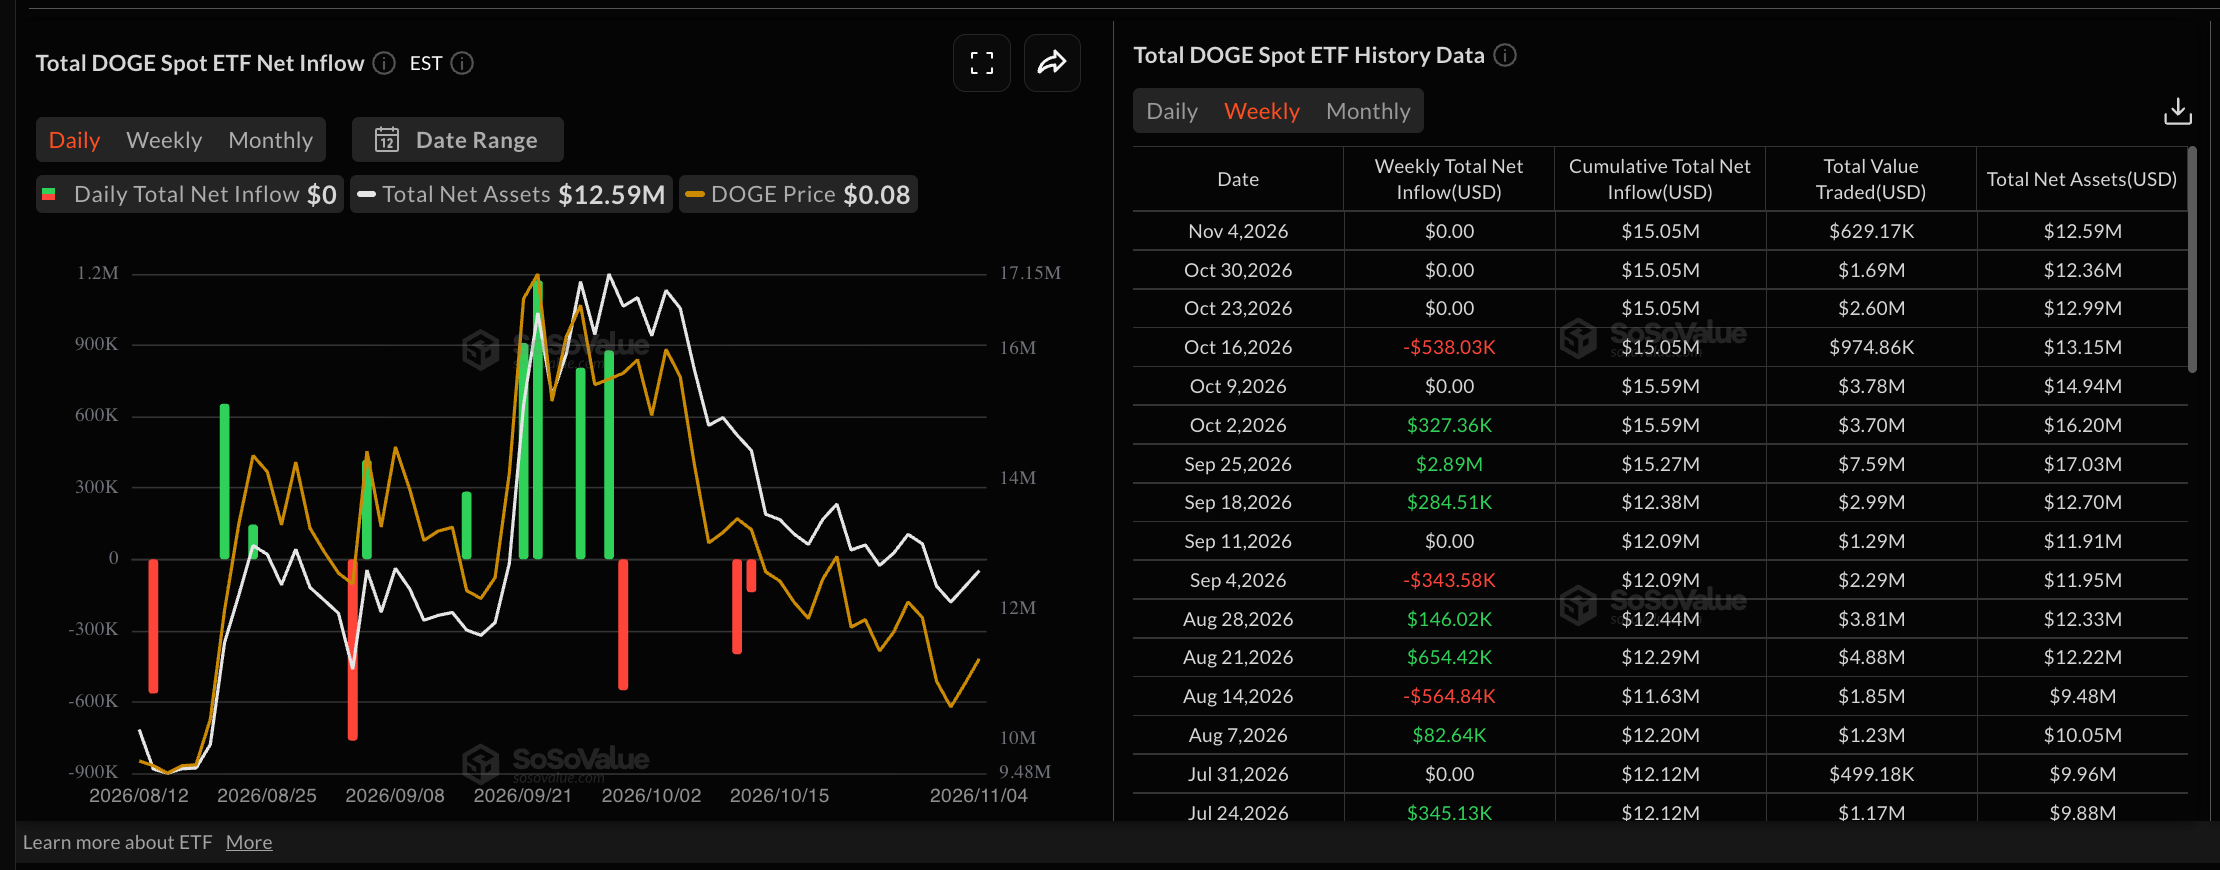
DOGE ETF data. Source: Sosovalue

However, if the ongoing recovery in DOGE holds steady, it could attract derivatives traders, followed by institutional investors as the broader crypto market sentiment recovers after Democrats swept the US midterm elections.

Technical outlook: Bullish rebound in DOGE flags breakout chances

Dogecoin trades near $0.0772 at press time on Thursday, sustaining its over 2% rebound from the previous day.

DOGE reclaims the 50-period Exponential Moving Average (EMA) at $0.0762 on the four-hour chart but remains capped below a long-term resistance trendline connecting the October 8 and 29 highs, near $0.0786. A confirmed breakout above $0.0786 could target the 200-period EMA, clustered with horizontal resistance, at $0.0806.

Momentum on the four-hour chart remains constructive, as the Relative Strength Index (RSI) hovers near 58 while the Moving Average Convergence Divergence (MACD) line remains marginally positive.

Chart Analysis DOGE/USDT (Binance)
DOGE/USDT four-hour price chart.

On the downside, initial support is provided by the 50-period EMA at $0.0762. A sustained break below this floor would expose the horizontal base at $0.0723, with a deeper bearish extension potentially targeting the lower support zone near $0.0677.

(The technical analysis of this story was written with the help of an AI tool. Know more.)

Disclaimer: For information purposes only. Past performance is not indicative of future results.
placeholder
TradingKey Daily Market Brief: Nasdaq Falls Over 5%, AI Stocks Plunge as Nvidia Drops Over 9%, Micron Falls Over 17%, SanDisk Drops Over 22% During the Asian trading session on November 6, the three major U.S. stock indices tumbled across the board overnight as the sell-off across the AI data center suppl
Author  TradingKey
Nov 06, Fri
During the Asian trading session on November 6, the three major U.S. stock indices tumbled across the board overnight as the sell-off across the AI data center suppl
placeholder
Micron's $4.5 billion Taiwan fab won't make a chip until 2028 — the market sold it as a 2026 problemMicron fell 17.46% to $656.39 after Bloomberg reported construction at its $4.5 billion Taoyuan Fab 11E had all but halted over a labor dispute. The plant was not due online until 2028, so no 2026 output is lost. With FY27 EPS consensus near $160 and 2027 HBM sold out, the selloff is a peak-cycle multiple reset, not a demand collapse — and $650 is the line that separates the two.
Author  Irene Q.
Nov 06, Fri
Micron fell 17.46% to $656.39 after Bloomberg reported construction at its $4.5 billion Taoyuan Fab 11E had all but halted over a labor dispute. The plant was not due online until 2028, so no 2026 output is lost. With FY27 EPS consensus near $160 and 2027 HBM sold out, the selloff is a peak-cycle multiple reset, not a demand collapse — and $650 is the line that separates the two.
placeholder
Gold Price Analysis Today | Forex Gold Analysis | XAU/USD Analysis - November 9, 2026Get the latest gold price analysis, forex gold insights, and XAU/USD analysis for November 9, 2026. Read on for the details.
Author  Mitrade
10 hours ago
Get the latest gold price analysis, forex gold insights, and XAU/USD analysis for November 9, 2026. Read on for the details.
placeholder
Bitcoin ETFs sold $1.28 billion in a week — and BTC is still above 75,000US spot Bitcoin ETFs logged $1.28 billion of net outflows in the week to Nov 6, the largest since late June, with BlackRock's IBIT accounting for $1.21 billion. Yet BTC only fell from $80,405 to $74,940, a 6.8% move. The gap between the fund flow and the price is the story: leveraged longs were flushed, but spot holders did not follow the ETFs out — and $75,000 is the line that decides whether that reading holds.
Author  Suzie
9 hours ago
US spot Bitcoin ETFs logged $1.28 billion of net outflows in the week to Nov 6, the largest since late June, with BlackRock's IBIT accounting for $1.21 billion. Yet BTC only fell from $80,405 to $74,940, a 6.8% move. The gap between the fund flow and the price is the story: leveraged longs were flushed, but spot holders did not follow the ETFs out — and $75,000 is the line that decides whether that reading holds.
placeholder
The CPI that has no year-over-year number is the one that decides DecemberOctober CPI lands on Nov 10 at 13:30 GMT, and it will be published without a year-over-year figure: BLS never collected October 2025 prices during the federal shutdown. Consensus is +0.3% headline and +0.2% core month-on-month, against +0.6% and +0.3% in September. With December hike odds at 77%, the month-on-month print is now the whole story, and $4,197–4,202 on gold and 4.86% on the 10-year are the levels that price it.
Author  Irene Q.
9 hours ago
October CPI lands on Nov 10 at 13:30 GMT, and it will be published without a year-over-year figure: BLS never collected October 2025 prices during the federal shutdown. Consensus is +0.3% headline and +0.2% core month-on-month, against +0.6% and +0.3% in September. With December hike odds at 77%, the month-on-month print is now the whole story, and $4,197–4,202 on gold and 4.86% on the 10-year are the levels that price it.
Related Instrument
goTop
quote