

Ripple and Stellar outlook: XRP and XLM rebound amid mixed signals

Source Fxstreet
  • XRP extends its rebound, trading at $1.300 on Thursday after finding support around the key EMAs the previous day.
  • XLM trades at $0.184 after recovering over 4% on Wednesday.
  • Mixed derivatives and on-chain data suggest indecisiveness and a cautious stance among traders.

Ripple (XRP) and Stellar (XLM) extend their recovery at the time of writing on Thursday after finding support at key technical levels. However, mixed derivatives and on-chain data for both altcoins suggest that traders remain cautious and have yet to show strong conviction in a sustained rebound.

Mixed derivatives metrics signal

Derivatives data shows a mixed and cautious outlook among traders. CoinGlass’ long-to-short ratios for Ripple read 1.06 on Thursday, nearing the highest level over a month. A ratio above one indicates bullish sentiment, as traders bet that asset prices will rise.

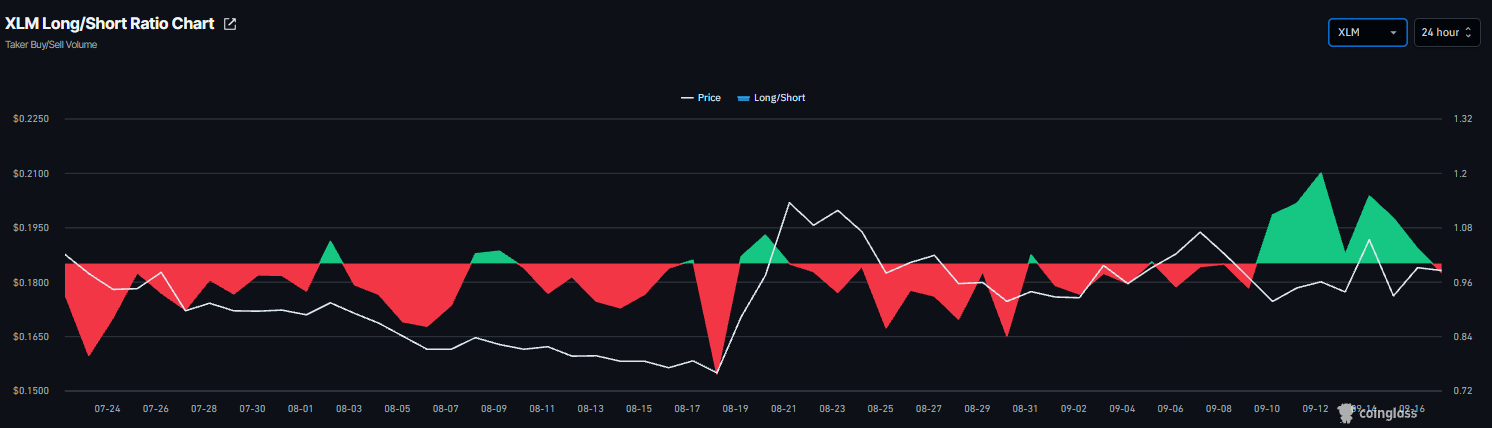
Meanwhile, XLM’s ratio read 0.97 on Thursday. A ratio below one indicates bearish sentiment, as traders bet that asset prices will fall.
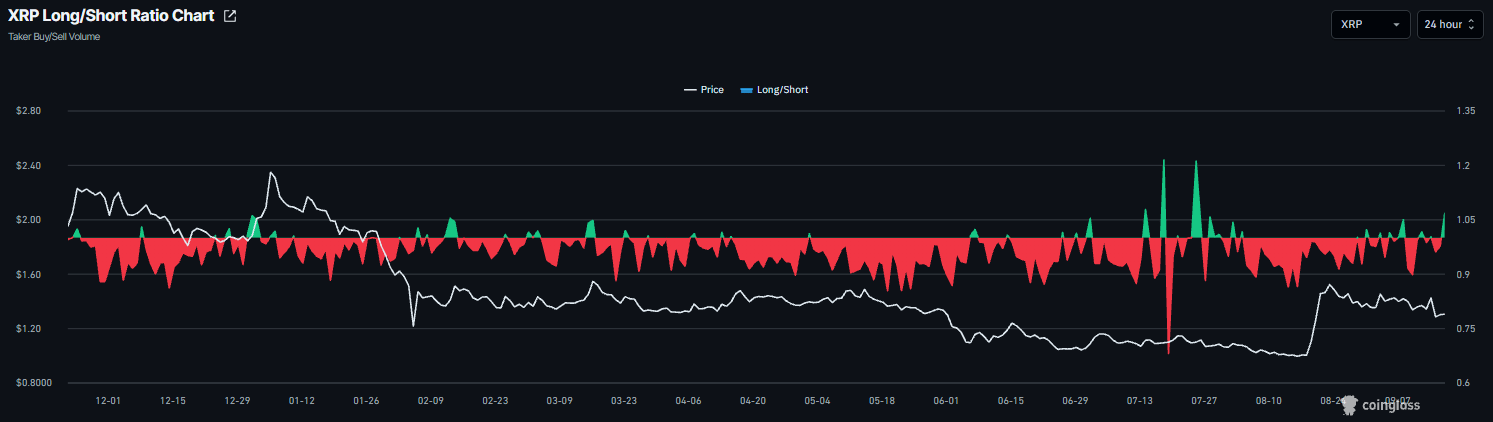
XRP long-to-short ratio chart. Source: CoinGlass
XLM long-to-short ratio chart. Source: CoinGlass

In addition, the XRP funding rate flipped negative on Wednesday, reading -0.0040% on Thursday. This indicates shorts are paying longs, reflecting a bearish outlook for XRP.

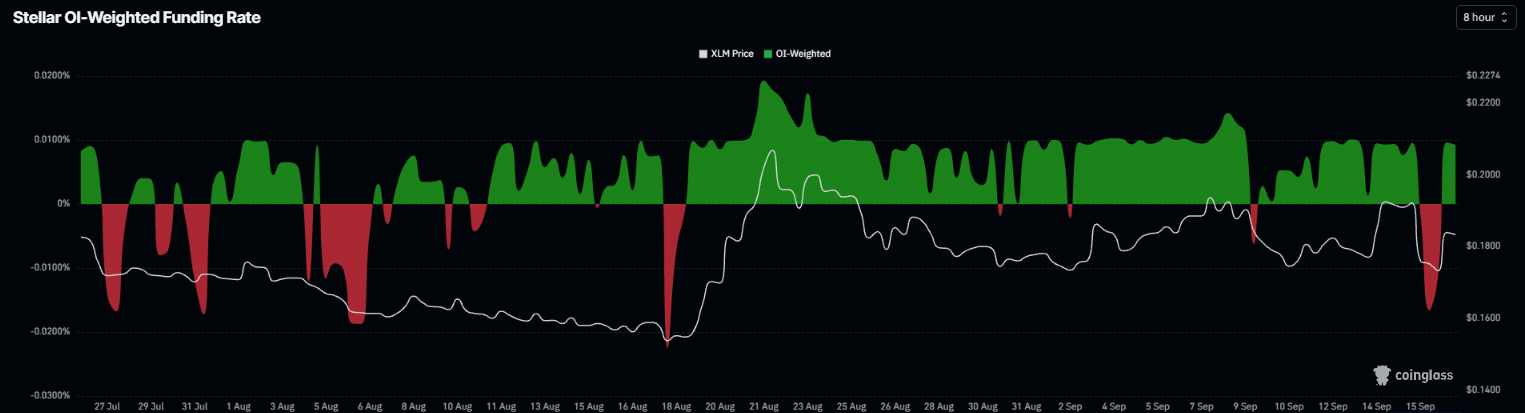
Meanwhile, the XLM funding rate flipped positive on Wednesday, reading 0.0093% on Thursday. This indicates longs are paying shorts, reflecting a bullish outlook for Stellar.
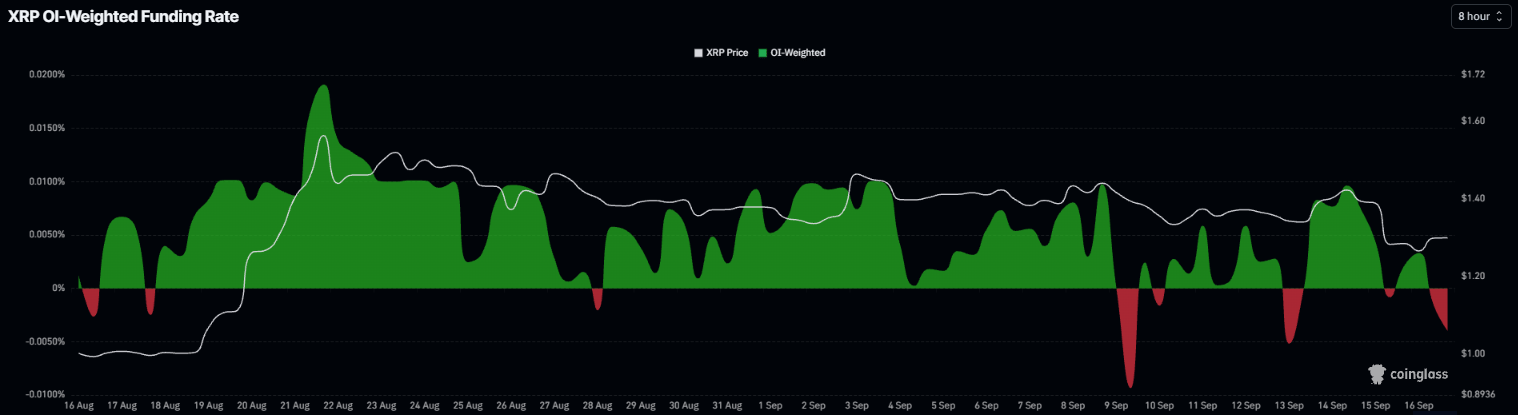
XRP funding rates chart. Source: CoinGlass
XLM funding rates chart. Source: CoinGlass

On-chain data shows slight bearish tilt

CryptoQuant’s summary data shows cautious signs for both altcoins. XRP’s spot and futures markets show overheating conditions, while the futures market shows sell-side dominance, and retail traders are active. These highlight a bearish, cautious sentiment bias among Ripple traders.

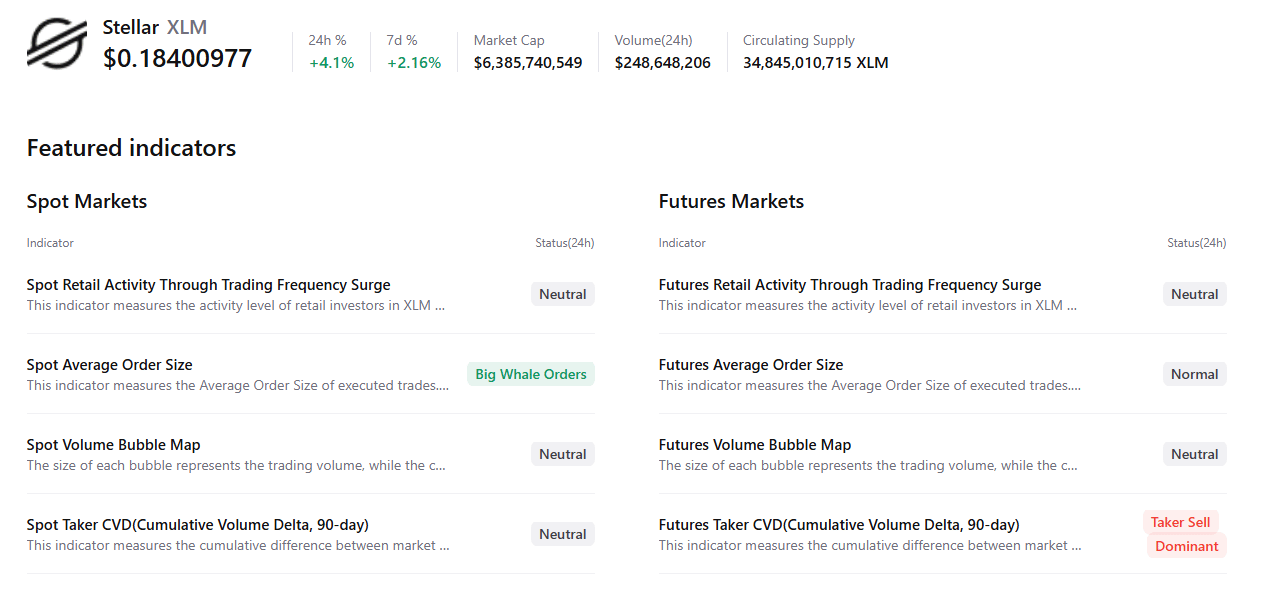
For XLM, spot shows large whale orders; however, the futures market also shows sell-side dominance, indicating a negative outlook among Stellar traders.
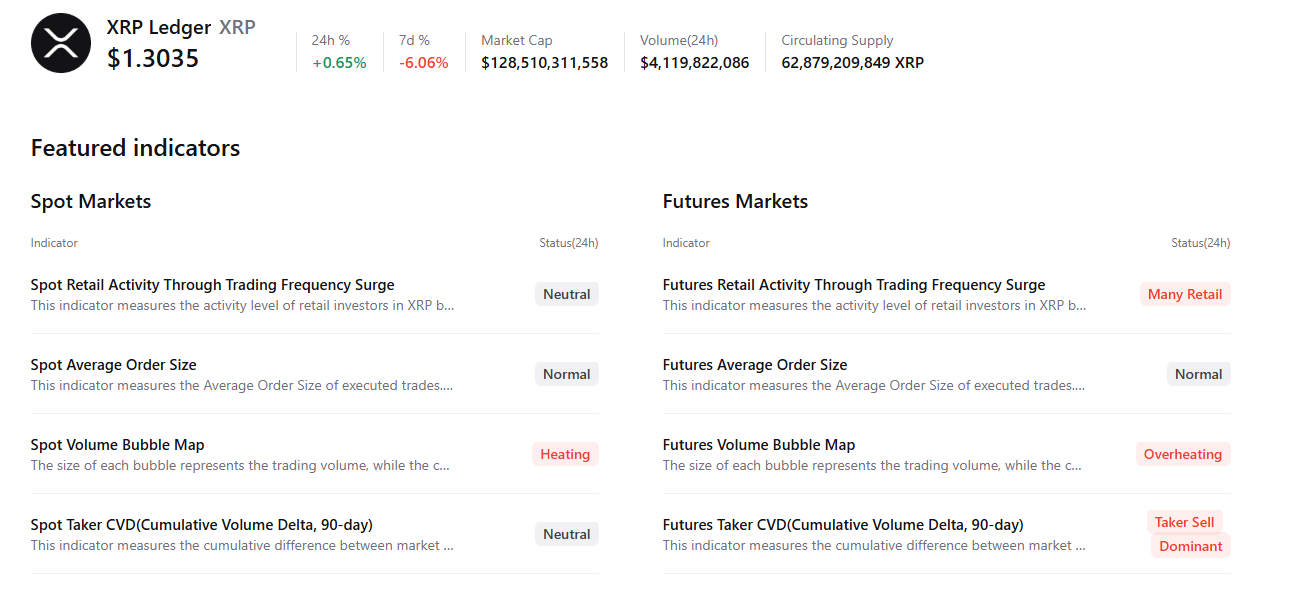
XRP summary data. Source: CryptoQuant
XLM summary data. Source: CryptoQuant

XRP technical outlook: Key support holds

XRP price trades at $1.300 on Thursday, holding a neutral, range-bound stance as it sits between clustered moving averages and higher trend resistance. XRP is marginally above the 50-day and 100-day Exponential Moving Averages (EMAs) at $1.284 and $1.255, which together suggest underlying demand in the $1.250–$1.280 area, but it remains capped by the 200-day EMA at $1.353 overhead.

Momentum has cooled, with the Relative Strength Index (RSI) slipping toward a neutral 46 and the Moving Average Convergence Divergence (MACD) below zero, hinting at waning bullish pressure and favoring consolidation rather than a sustained directional move as price oscillates around the $1.300 handle.

On the downside, initial support is clustered just under the market at $1.300, backed by the 50-day EMA at $1.284 and the 100-day EMA at $1.255, which together define a broader demand band that would need to give way to expose the next major floor near $1.000.

On the topside, immediate resistance is located at the 200-day EMA at $1.353; a daily close above this barrier would open the path toward the distant horizontal resistance near $1.900, while failure to clear $1.353 keeps XRP trapped in its current range and leaves the $1.300 area vulnerable to a corrective pullback.
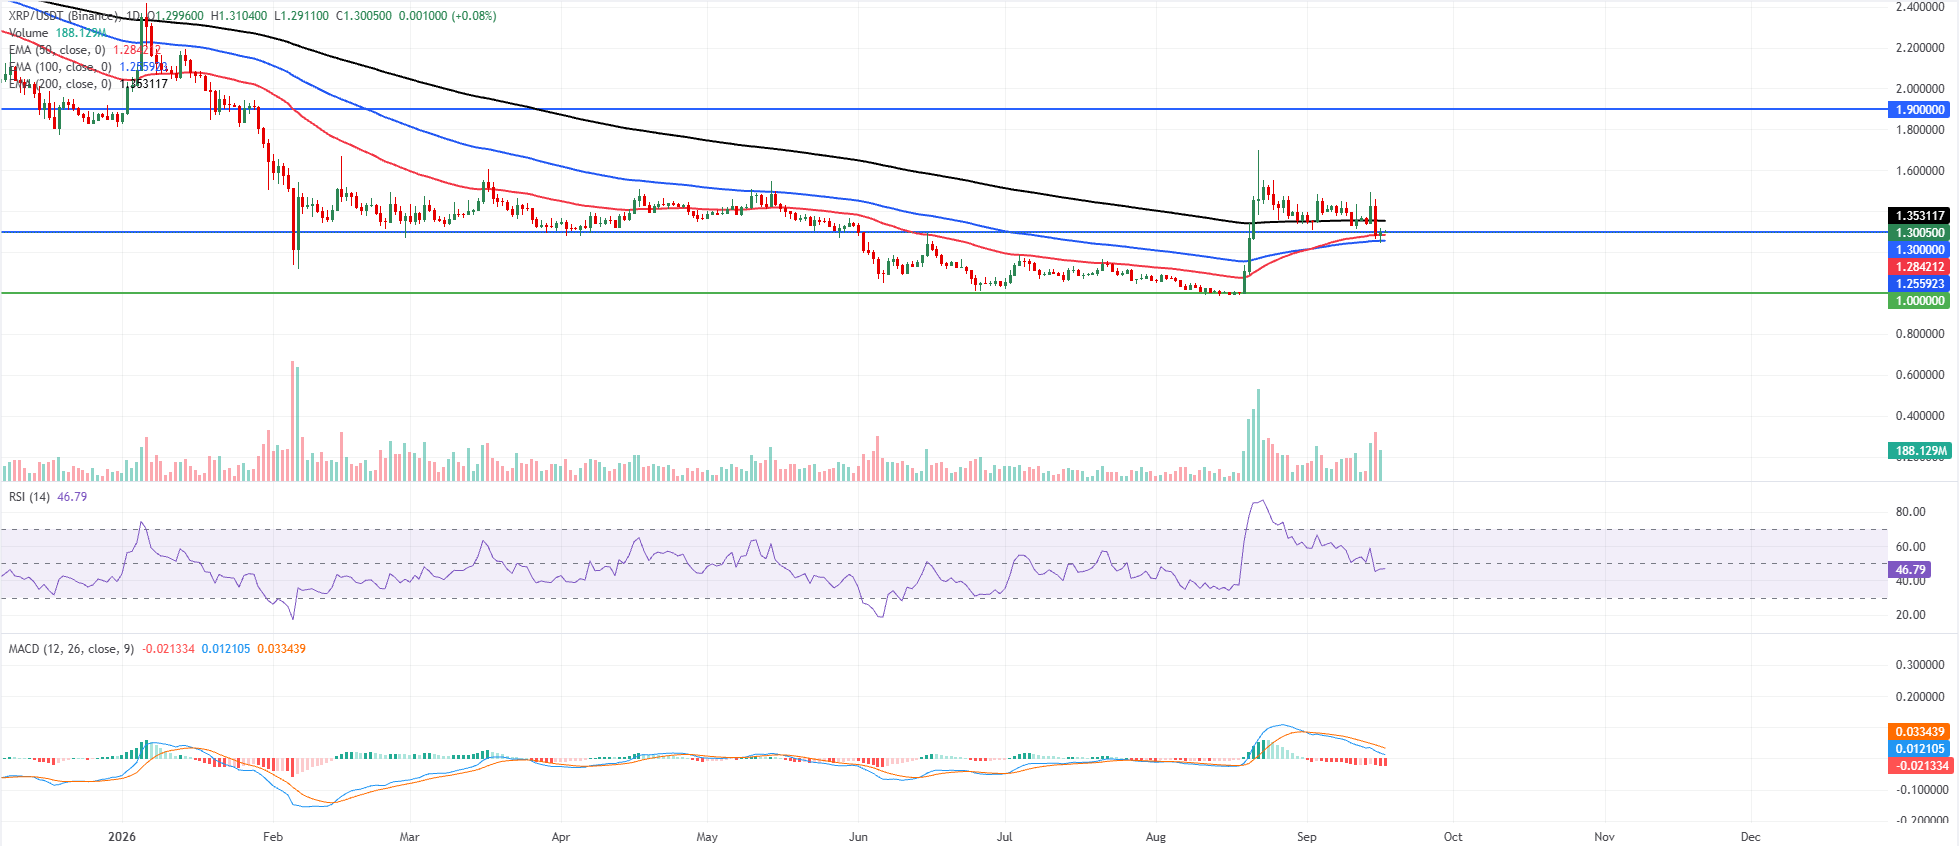
XRP/USDT daily chart

XLM technical outlook: Finds support around key zone

XLM price trades at $0.184 on Thursday, holding above the 50-day and 100-day EMAs clustered near $0.180, which lends a tentative constructive tone, but the pair remains capped by the 200-day EMA at roughly $0.188.

The RSI around 52 suggests neutral-to-mildly bullish momentum, while the MACD indicator sits marginally negative, hinting at waning upside as price consolidates just below the longer-term trend barrier.

On the topside, initial resistance is located at the 200-day EMA near $0.188, ahead of a more significant hurdle at the 61.8% Fibonacci retracement of the latest swing at $0.200; a daily close above these levels would open the way toward the 50% retracement at $0.218 and the higher Fibonacci cluster between $0.237 and $0.260.

On the downside, immediate support emerges at the horizontal level around $0.177, reinforced by the 78.6% Fibonacci retracement at $0.173, while a deeper pullback would expose the next structural floor near $0.142.
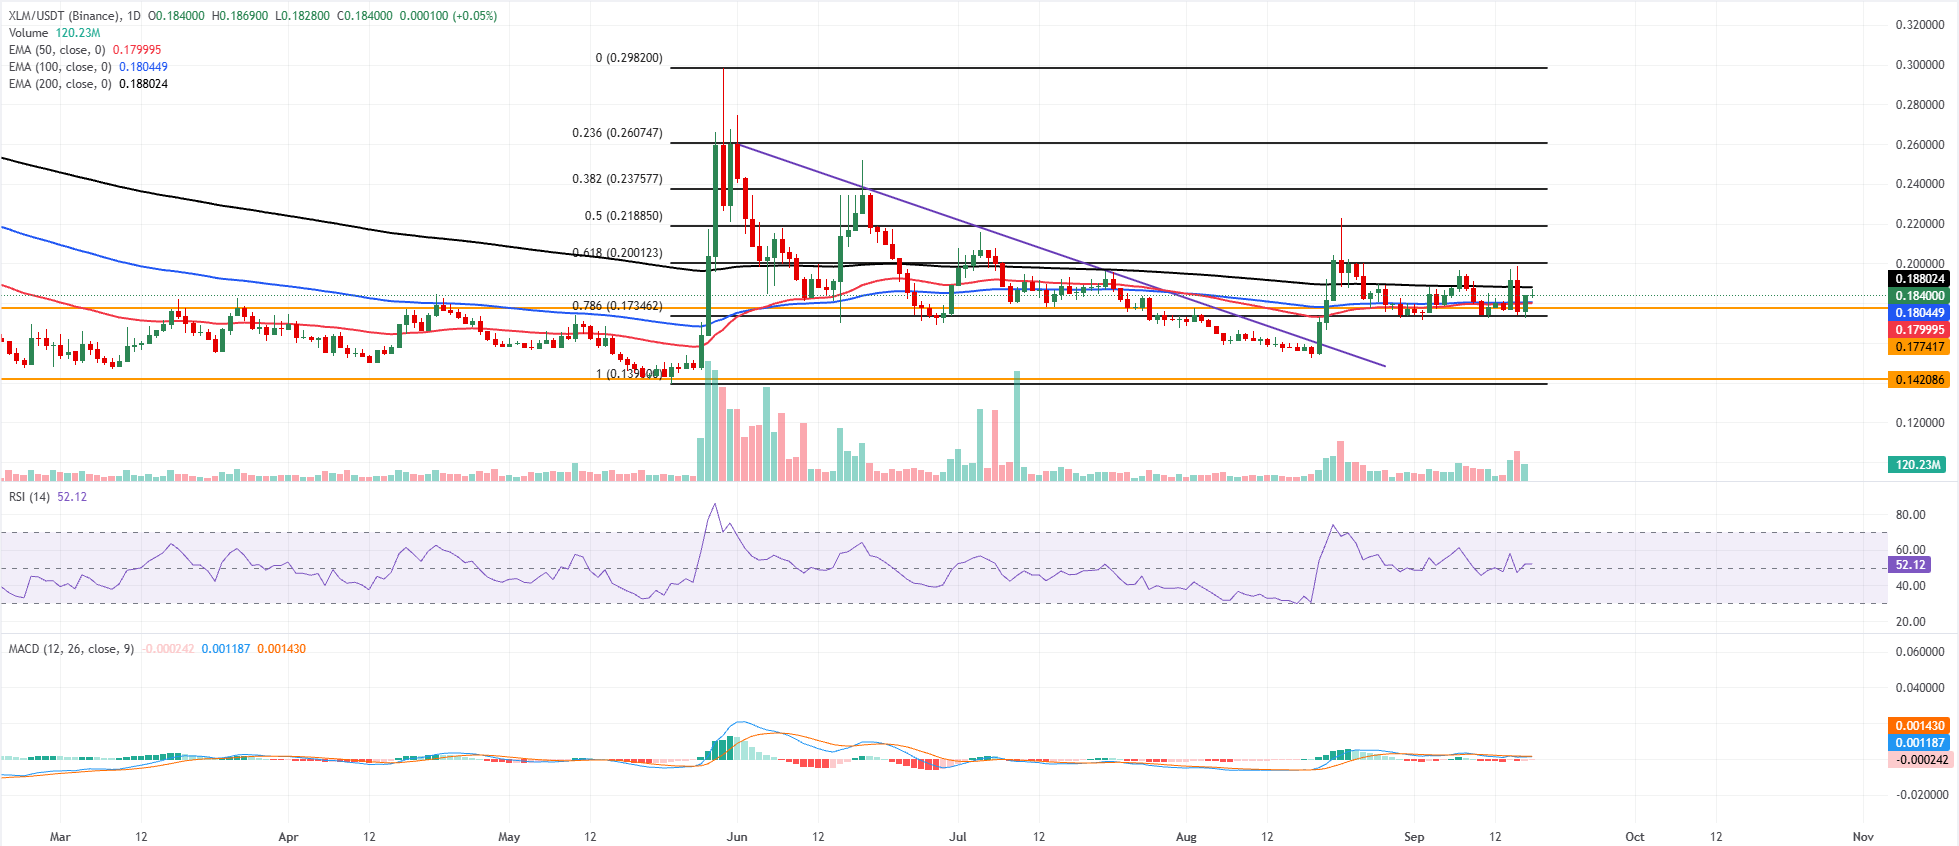
XLM/USDT daily chart

(The technical analysis of this story was written with the help of an AI tool. Know more.)

Disclaimer: For information purposes only. Past performance is not indicative of future results.
placeholder
Fed hike odds near 90% into Wednesday's decision — how to trade the dollar, gold and the S&P 500A 0.3% monthly core CPI print has lifted the market-implied probability of a 25bp Fed hike on 16 September to roughly 86.5% ~ 90%, which would be the first increase since July 2023. Here is the decision timeline, the pricing versus the forecasts, both scenarios, and the key levels for the dollar, gold and the S&P 500.
Author  Suzie
Sep 14, Mon
A 0.3% monthly core CPI print has lifted the market-implied probability of a 25bp Fed hike on 16 September to roughly 86.5% ~ 90%, which would be the first increase since July 2023. Here is the decision timeline, the pricing versus the forecasts, both scenarios, and the key levels for the dollar, gold and the S&P 500.
placeholder
【Daily Brief】10-year Treasury yield briefly tops 5%, S&P 500 slips to 7,602 and the dollar firms at 99.3 as the Fed's decision eve beginsThe 10-year Treasury yield touched 5.014% on Monday — its first print above 5% since October 2023 — while the S&P 500 closed 0.48% lower at 7,619.98 and the dollar index firmed to 99.3. Here is the full market wrap ahead of Wednesday's FOMC decision, the dot plot and the August retail sales report, plus today's CLARITY Act Senate vote.
Author  Irene Q.
Sep 15, Tue
The 10-year Treasury yield touched 5.014% on Monday — its first print above 5% since October 2023 — while the S&P 500 closed 0.48% lower at 7,619.98 and the dollar index firmed to 99.3. Here is the full market wrap ahead of Wednesday's FOMC decision, the dot plot and the August retail sales report, plus today's CLARITY Act Senate vote.
placeholder
Silver breaks $64 as precious metals rebound — can gold hold the $4,280 line into the Fed decision?Silver has climbed back above $64 an ounce for the first time this week, leading a broad rebound across precious metals hours before the Federal Reserve delivers what is expected to be its first rate hike since 2023. Spot silver was last at $64.64, up 1.49% on the day, while gold reclaimed $4,300 and platinum and palladium both advanced. The question now is whether the bounce is a genuine turn — or a pause before the Fed's dot plot decides the next move.
Author  Suzie
22 hours ago
Silver has climbed back above $64 an ounce for the first time this week, leading a broad rebound across precious metals hours before the Federal Reserve delivers what is expected to be its first rate hike since 2023. Spot silver was last at $64.64, up 1.49% on the day, while gold reclaimed $4,300 and platinum and palladium both advanced. The question now is whether the bounce is a genuine turn — or a pause before the Fed's dot plot decides the next move.
placeholder
Bitcoin falls below $75,000 as the CLARITY Act fails in the Senate — what the vote means for cryptoThe US Senate blocked the Digital Asset Market CLARITY Act in a 49-50 procedural vote, sending Bitcoin briefly below $75,000 — its biggest one-day drop since June. Ethereum fell more than 8%, Coinbase slid 10% and $75 billion of crypto market value evaporated. Here is what the vote was, why it failed, and the levels that matter now.
Author  Suzie
21 hours ago
The US Senate blocked the Digital Asset Market CLARITY Act in a 49-50 procedural vote, sending Bitcoin briefly below $75,000 — its biggest one-day drop since June. Ethereum fell more than 8%, Coinbase slid 10% and $75 billion of crypto market value evaporated. Here is what the vote was, why it failed, and the levels that matter now.
placeholder
Dow drops 631 points as the Fed hikes — but futures are rebounding: what's next for US stocks?The Dow fell 631 points and the S&P 500 closed below 7,600 after the Fed hiked rates for the first time since 2023, with the dot plot showing 16 of 18 officials expect more tightening. Asia-session futures are already recovering — here are the levels and analyst views that decide whether 7,500 holds.
Author  Irene Q.
3 hours ago
The Dow fell 631 points and the S&P 500 closed below 7,600 after the Fed hiked rates for the first time since 2023, with the dot plot showing 16 of 18 officials expect more tightening. Asia-session futures are already recovering — here are the levels and analyst views that decide whether 7,500 holds.
Related Instrument
goTop
quote