


XRP at $1.30 vs. Its $3.84 All-Time High: What a 60% Recovery Actually Requires - Realistic Timeline or Dead Chart?
TradingKey -Undoubtedly, XRP has one of the most optimistic communities in all of crypto. Even with XRP hovering around $1.3 today, members of the XRP Army often share predictions of XRP at $5-$10 by the end of the next bull cycle.
However, the elephant in the room remains that XRP’s current $3.84 all-time high is from its historic 2017-2018 rally. So, before we talk about a new ATH, let’s consider what it will realistically take to spark a 60% recovery and send XRP to its current ATH. Or, is XRP just another dead chart? Let’s dissect the numbers.
Why the $3.84 ATH Appears To Be a Ghost
Over the last two bull cycles, the XRP Army has watched other cryptos hit new ATH’s while XRP just remains there. While the XRP vs. SEC case certainly contributes to this, one major issue why $3.84 has been a ghost is simply supply inflation.
There were approximately 39 billion tokens in circulation in January 2018, when XRP briefly reached $3.84, and everyone in the XRP Army was planning private island purchases. The market value was about $150 billion, fueled by pure retail frenzy.
Today, Ripple’s monthly escrow releases have steadily pushed the circulating supply up to somewhere 63 billion tokens. This supply inflation makes the math brutal for XRP. To reach $3.84 today, XRP wouldn’t just need 2018 levels of hype. It would need a market cap hovering around $242 billion.
Retail FOMO won’t push XRP’s market cap from $90 billion to $242 billion. That requires deep, institutional liquidity. And right now? Roughly 63% of XRP supply is held at a loss, per data from Glassnode.
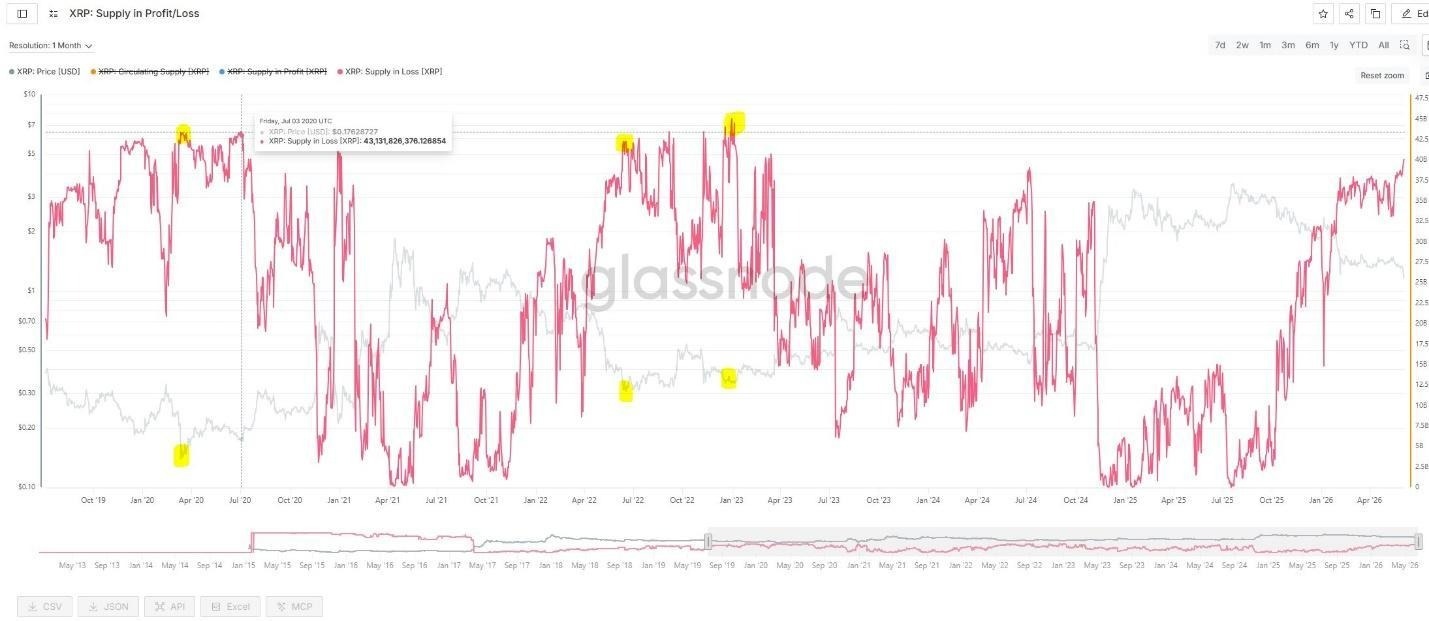 XRP Supply in Profit/Loss. Source: Glassnode
The realized price, what the average holder actually paid for their bags, is around $1.3. That creates massive friction on the charts. Every time the price creeps up, exhausted bagholders sell just to break even. It heavily caps the rallies before they can even breathe.
The XRP Network Isn’t Dead
In any case, XRP is still one of the most popular blockchains, despite its recent poor performance. As of mid-September 2026, the XRP Ledger (XRPL) officially shattered its previous records, hitting an all-time high of 8,571,187 total active addresses.
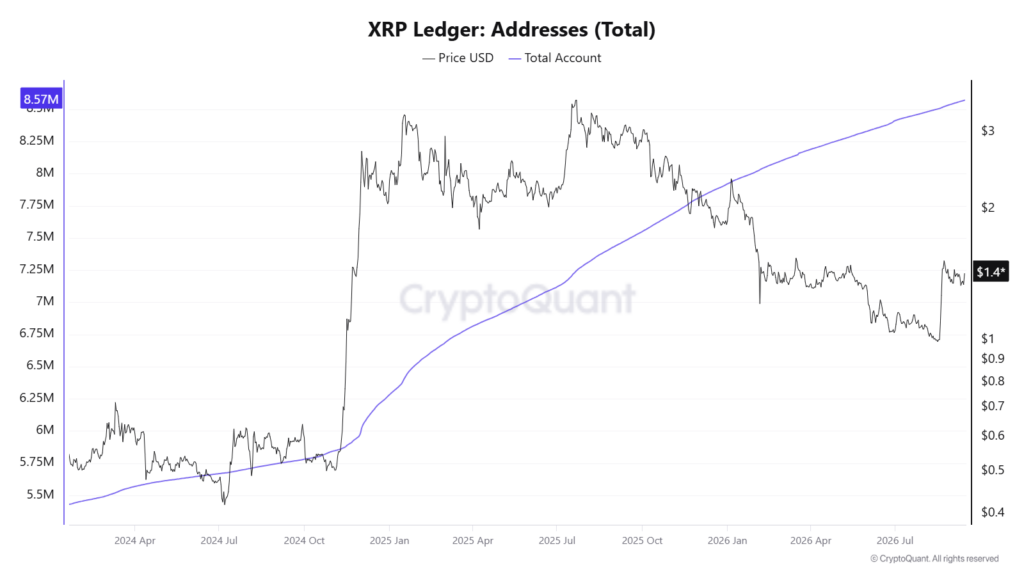 Total Addresses on XRP Ledger. Source: CryptoQuant
The network has taken in almost 650,000 new addresses unique to it since January 1st, representing an 8.2% YTD increase. The number of users migrating to XRP has been increasing due to its utility. A huge surge in tokenization initiatives is taking place on the network.
With XRP’s market cap comfortably pushing past $89 billion recently, this on-chain metric is the ultimate leading indicator. When active wallets grow, liquidity follows. And when liquidity deepens, the volatility required to break heavy resistance levels becomes fundamentally possible.
The Catalyst To $3.84
With its network still very active, there is hope that XRP can return to $3.84 someday. These are some catalysts that can push the price of XRP to a new ATH.
Real-World Assets (RWAs)
RWAs is the hottest sector in crypto right now, and the XRP Ledger is aggressively positioning itself as the undisputed king of this trillion-dollar arena. Over $5.4 billion in tokenized assets are already living on the XRPL.
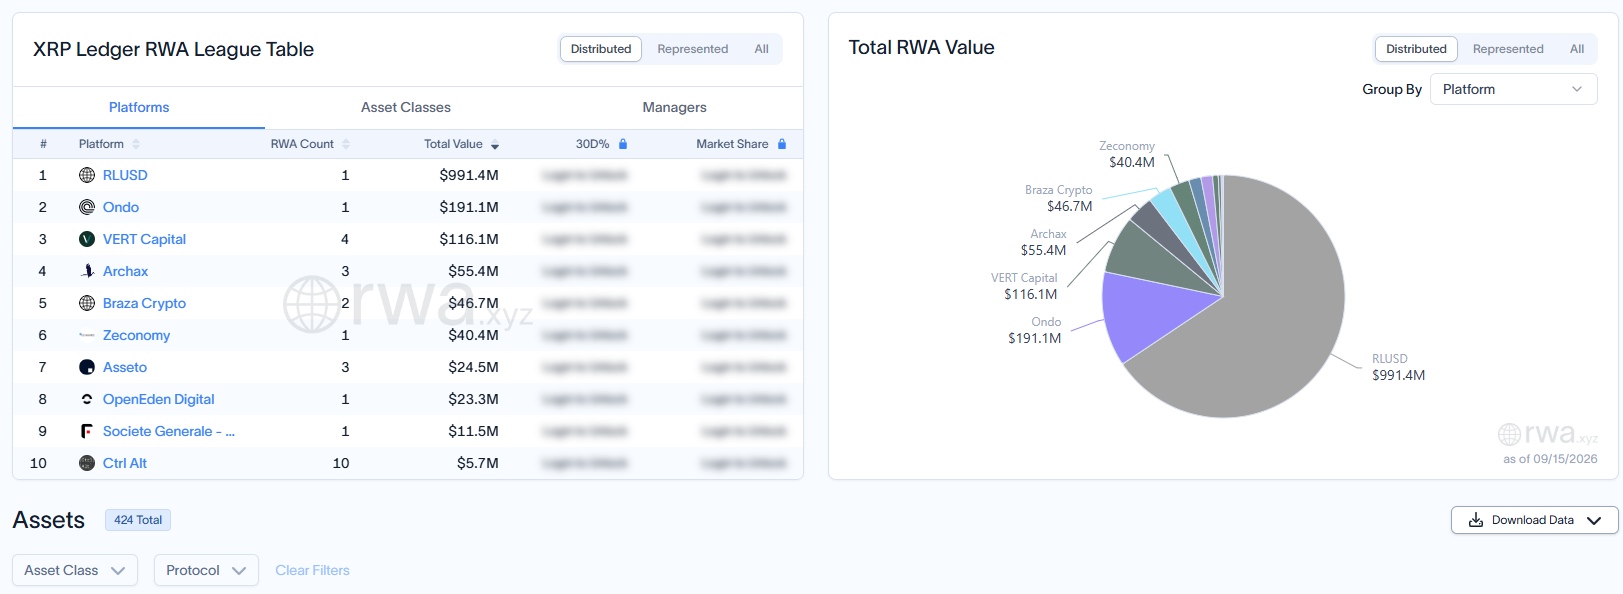 XRP Ledger RWA Table. Source: RWA.xyz
Stablecoins, treasury bills, you name it. Ripple Labs hasn’t been sitting on its hands, either. Strategic buyouts like the acquisition of Hidden Road (now Ripple Prime) and GTreasury (now Ripple Treasury) show a coordinated effort to lock down the institutional market.
The ETF Effect and Post-SEC Clarity
We spent years obsessing over the SEC lawsuit. While Ripple scored its victories, the XRP price action has remained stubborn. Enter the CLARITY Act. This piece of legislation is basically the golden ticket for altcoins.
If passed, it permanently locks in XRP’s status as a commodity. Without it, the heavy traditional finance hitters won’t touch the token with a ten-foot pole. Even with spot XRP ETFs now a reality, the inflows have been surprisingly moderate. This is because institutional capital is notoriously slow.
They are known to accumulate quietly, OTC, over months. The ETF filings were the starting gun, not the finish line. We are in the digestion phase. The market is slowly repricing XRP not as a risky, unregulated security, but as a standard, compliant financial instrument.
Is XRP a Dead Chart or Will It Hit a New ATH?
XRP is the ultimate test of trader patience. It’s been aggressively consolidating in a multi-year wedge that makes seasoned analysts want to pull their hair out. Every technical indicator on the monthly timeframe has been stretched to the absolute oversold limits.
It’s not a dead chart. The network address growth and RWA tokenization prove the fundamental base is vastly stronger than it was in 2018. But it is a heavy chart. Getting back to that $3.84 magnet isn’t going to be a sudden, overnight miracle driven by retail FOMO.
Standard Chartered’s head of digital assets research, Geoffrey Kendrick, is betting on XRP at $12.60 by 2028. Is it possible? Sure. Is it probable? Only if the stars perfectly align. A 9x gain from current prices requires zero regulatory hiccups, massive ETF demand wildly outpacing the 200–400 million XRP that hit the market from escrow every month, and a flawless macro environment.
Realistically? If Bitcoin stays bullish and the CLARITY Act passes, we see XRP retesting its 2018 all-time high over the next 12-18 months, especially with the growing interest in its network. However, it’s going to be a slow, grinding war of attrition against supply unlocks and impatient sellers who just want to break even.
Recommended Articles


