


Bitcoin and Gold Outlook: BTC and XAU drop as US PPI broadens rate-hike bets
- Bitcoin slides and trades around $77,000 on Thursday as US economic data reinforces rate-hike expectations.
- Gold retains a neutral-to-bearish outlook as it tests support from a major moving average cluster.
- US headline PPI rose 5.4% annually in August, exceeding the market expectation of 5.3%.
Cryptocurrency prices are broadly correcting, led by Bitcoin (BTC), which is trading around $77,000 on Thursday, marking four consecutive days of declines. Meanwhile, Gold (XAU) remains sideways, hovering around $4,365, with upside capped below $4,400.
US PPI fuels rate-hike bets
The latest Bureau of Labor Statistics (BLS) data shows the US Producer Price Index (PPI) climbed 5.4% annually in August, narrowly surpassing market expectations of 5.3% and accelerating from July’s upwardly revised 4.8% gain.
Excluding food and energy, core PPI rose 4.6% YoY, in line with consensus and up from July’s revised 4.3% increase. On a monthly basis, the headline PPI edged up 0.4%, and the core PPI rose by 0.2%.
Market participants are growing concerned that the Federal Reserve (Fed) will adopt a stricter monetary policy to curb mounting price pressures, as reflected in the CME FedWatch tool, which edged above 70% on Thursday following the PPI report, up from roughly 61% the day before.
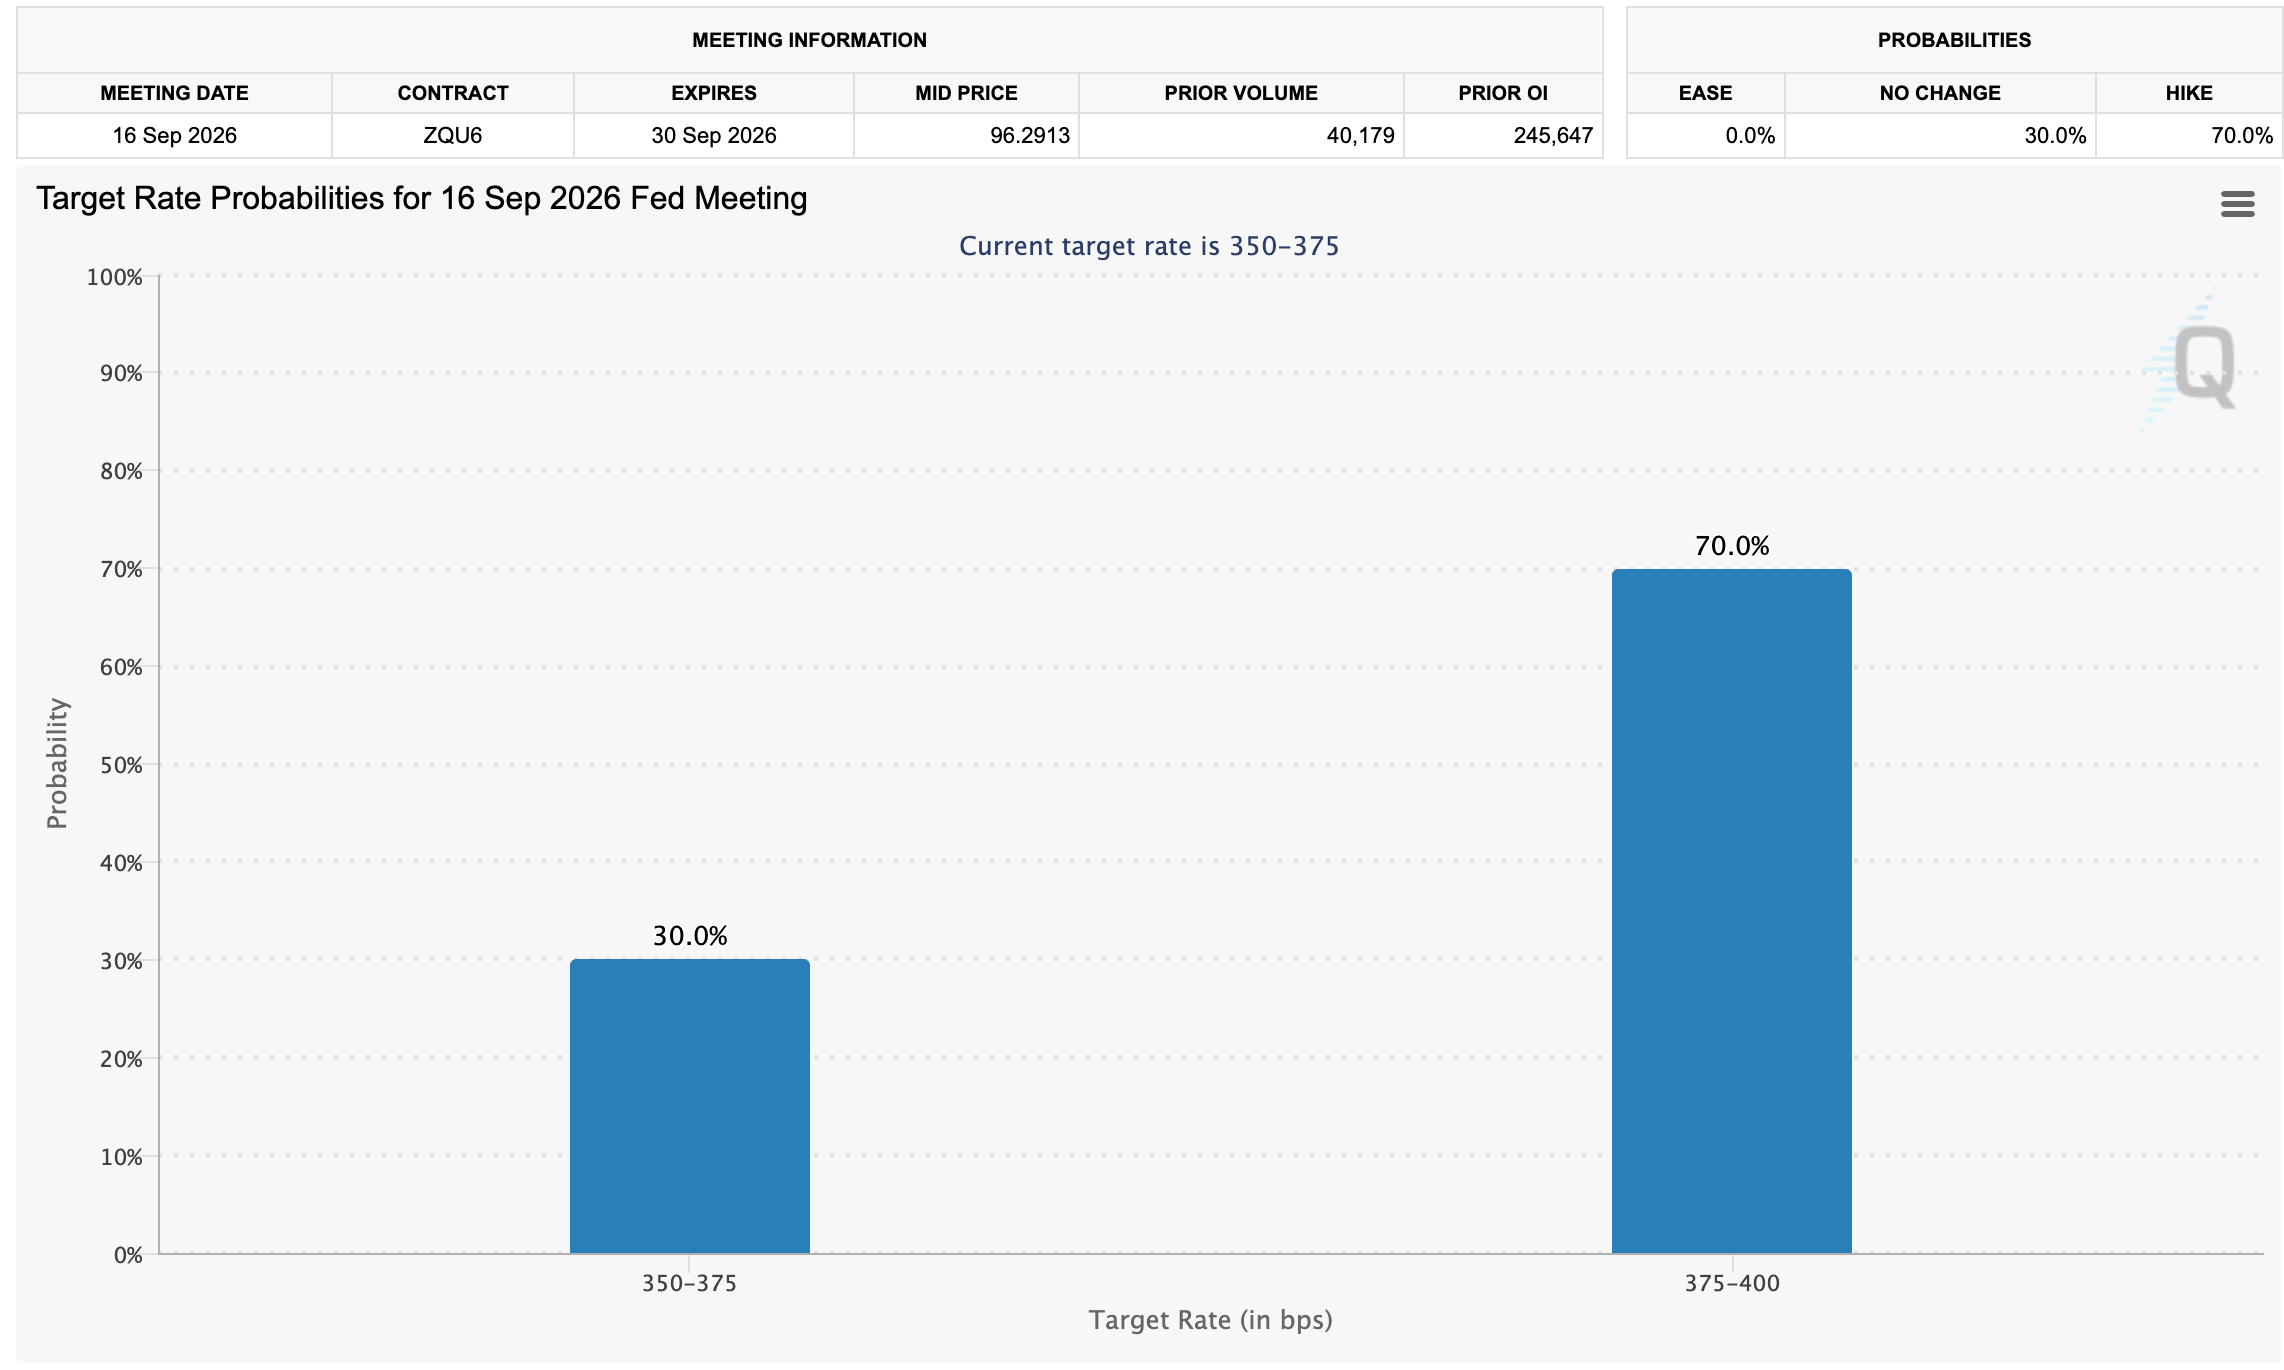
At the same time, investor attention remains on the release of the US Consumer Price Index (CPI) report on Friday, which could offer additional insight into the direction the Federal Open Market Committee (FOMC) would take.
A higher-than-expected CPI print would signal persistent inflationary pressures in the US economy, increasing the likelihood of an interest rate hike on Wednesday. Conversely, a softer-than-anticipated CPI reading would strengthen the case for an extended pause.
“With the FOMC approaching, Thursday’s PPI and Friday’s CPI releases are key volatility catalysts, while the September 15 Senate cloture vote on the CLARITY Act adds a crypto-specific risk event,” a K33 Research report states.
Technical Analysis: Bitcoin extends decline
Bitcoin trades above $77,000 following a persistent correction from highs above $80,000. Despite the pullback, BTC holds a constructive bullish bias, as price remains well above key Exponential Moving Averages (EMAs), suggesting the broader uptrend is still intact despite the recent pullback from the highs.
The SuperTrend line at $72,788 also runs below the market, reinforcing the notion of an underlying supportive structure, while the Relative Strength Index (RSI) around 55 hints at moderated, rather than overextended, upside pressure even as the Moving Average Convergence Divergence (MACD) remains in negative territory, hinting at waning momentum within an otherwise positive backdrop.
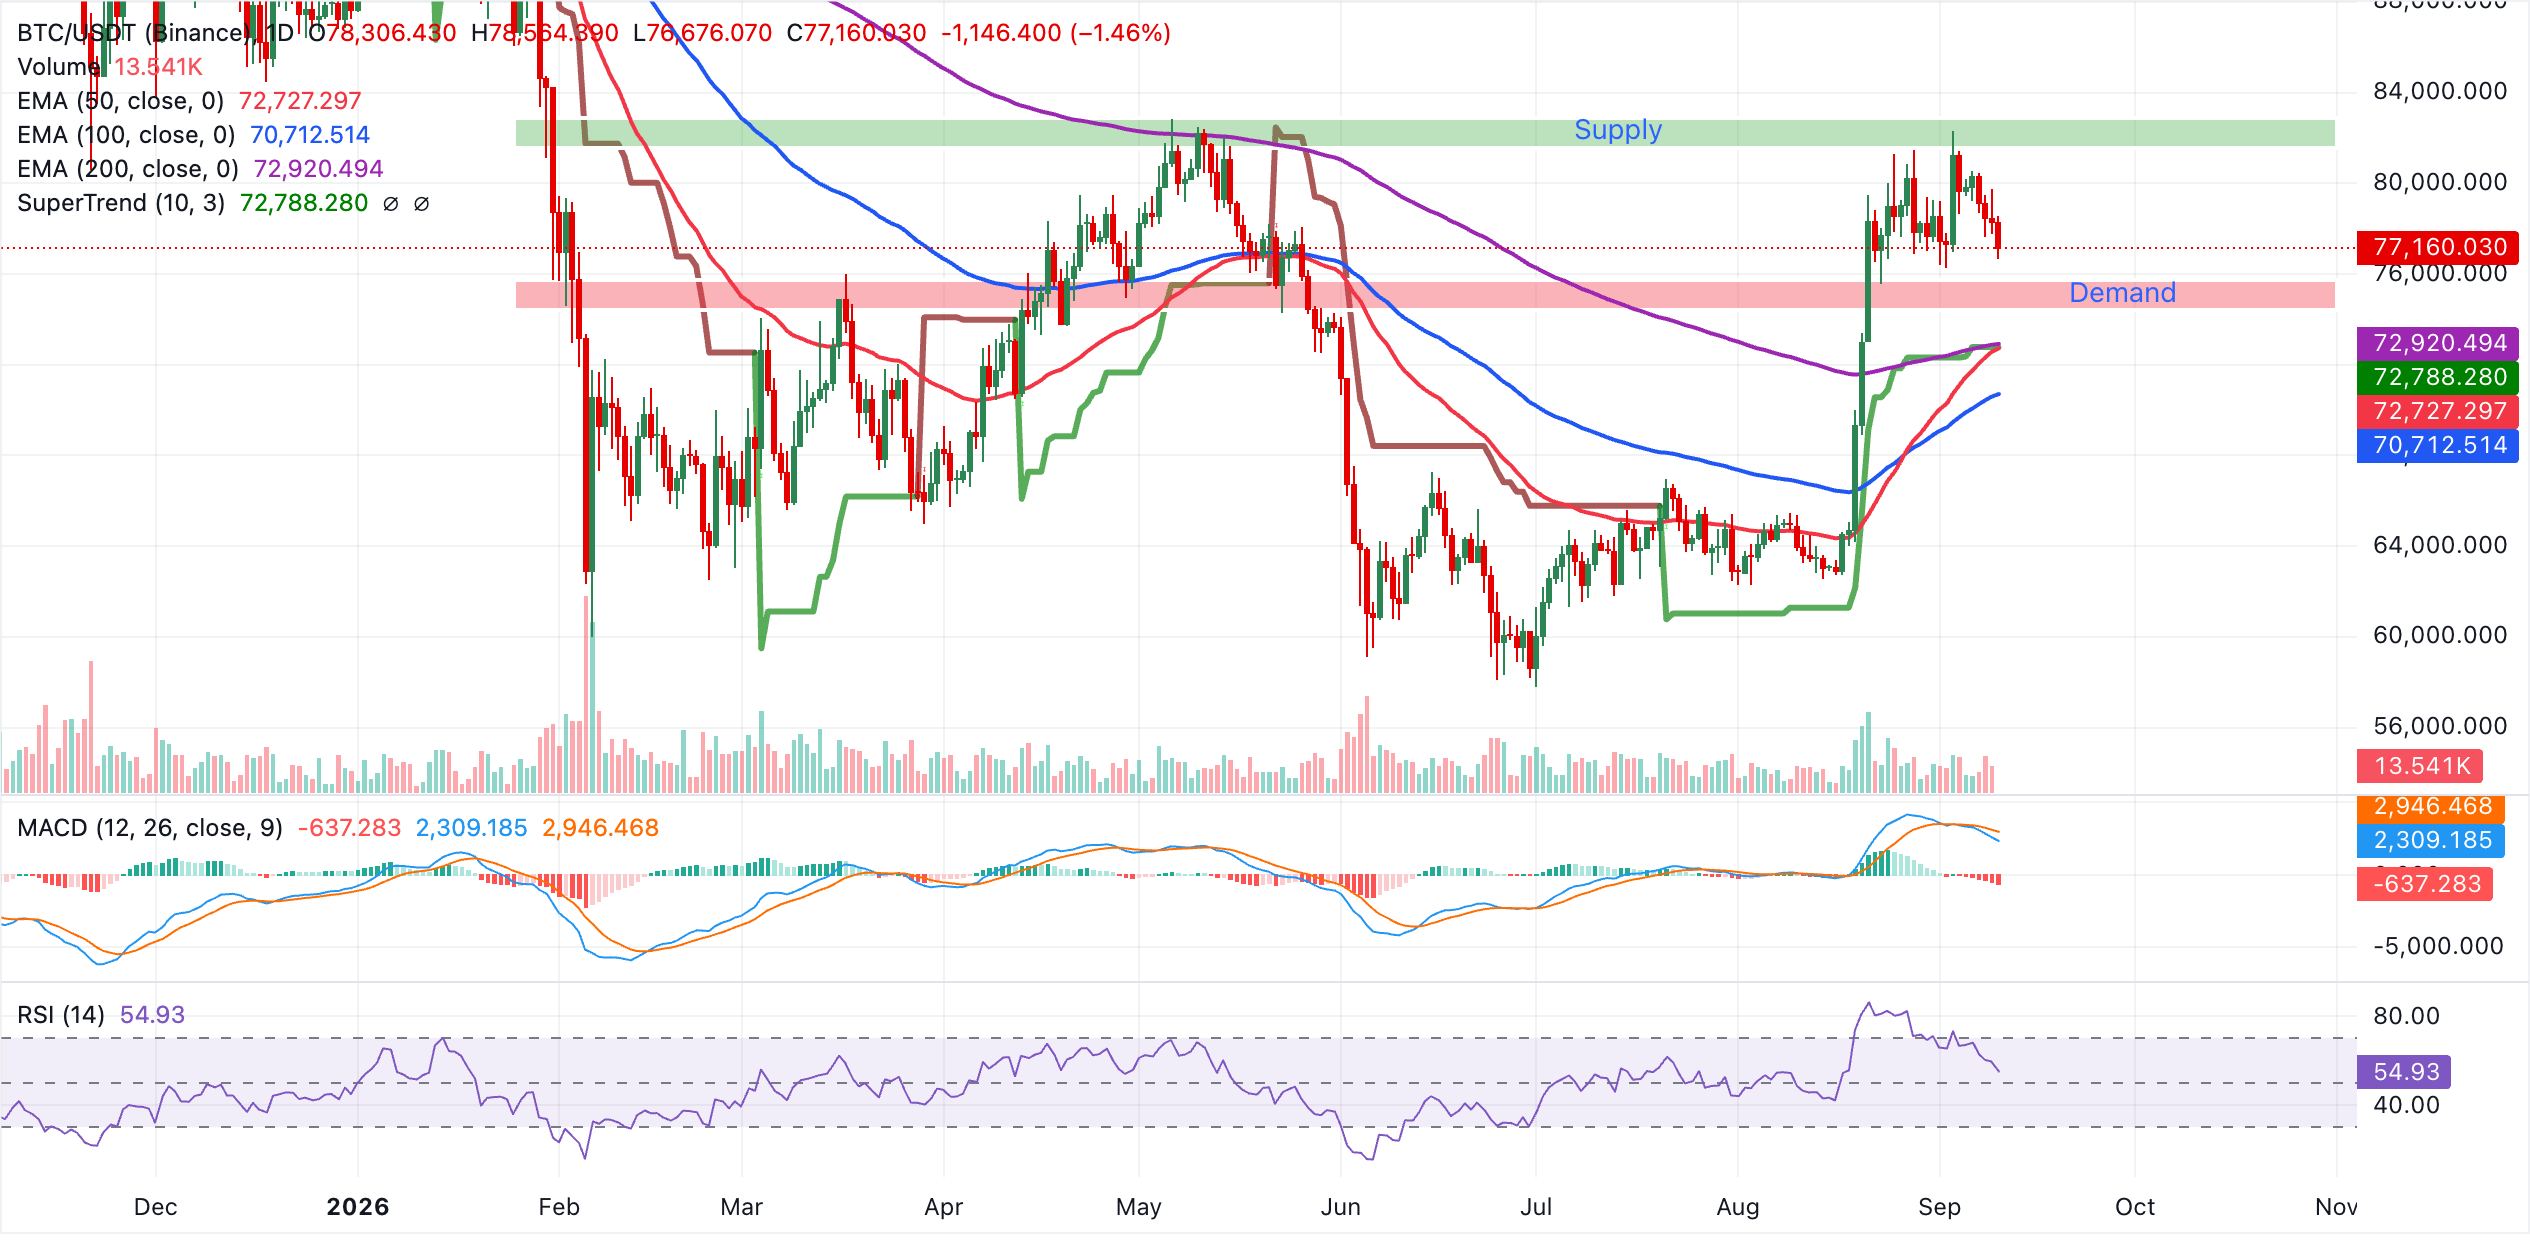
Initial support clusters between the 50-day EMA at $72,727, the SuperTrend line at $72,788, and the 200-day EMA at $72,920, creating a dense demand band that bulls would be expected to defend on any deeper retracement. A break below that area would expose the next key cushion at the 100-day EMA near $70,713, where buyers could attempt to reassert control to preserve the daily uptrend structure.
Gold technical analysis: XAU holds key support
Gold retains a mildly bullish near-term tone as price holds above the 50-day, 100-day, and 200-day EMAs clustered between roughly $4,320 and $4,368, suggesting a supportive underlying trend despite recent consolidation.
However, momentum has cooled, with the RSI slipping back toward the neutral 50 area and the MACD indicator deep in negative territory, suggesting upside traction is tentative rather than impulsive for now.
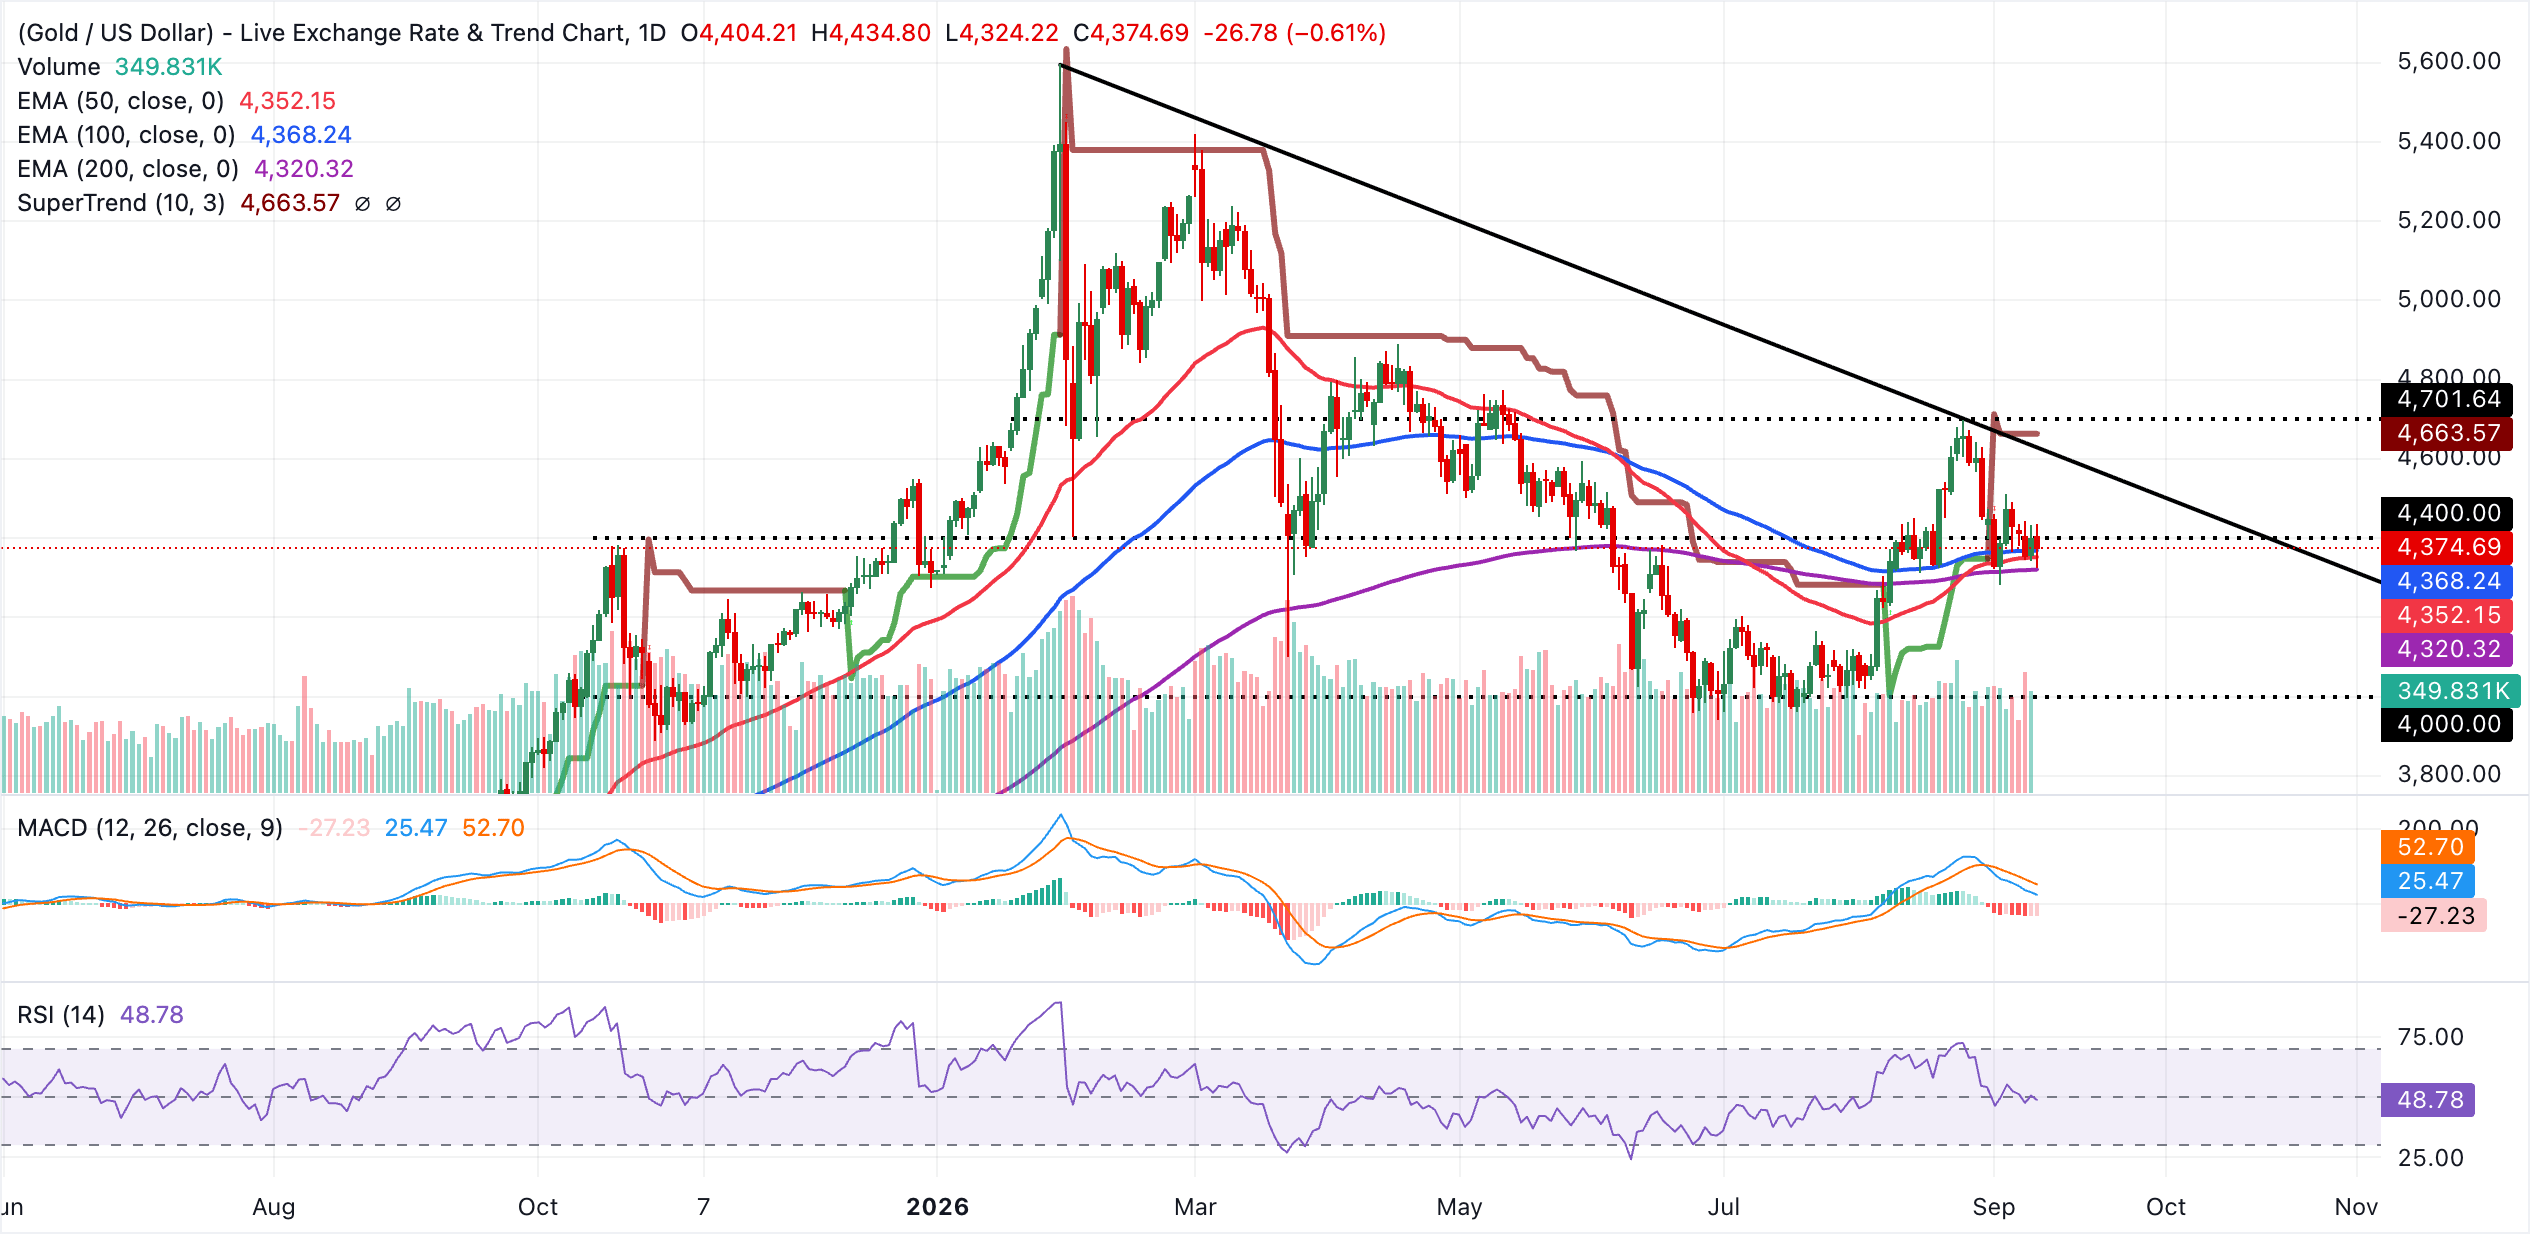
On the topside, initial resistance emerges at $4,400, followed by the downward resistance trendline break area around $4,514, with a more substantial cap at the SuperTrend line currently sitting higher at $4,664. On the downside, immediate support comes from the 100-day EMA at $4,368, followed by the 50-day EMA at $4,352, while the 200-day EMA near $4,320 forms a deeper structural floor that would need to give way to meaningfully undermine the prevailing constructive bias.
(The technical analysis of this story was written with the help of an AI tool. Know more.)
Bitcoin, altcoins, stablecoins FAQs
Bitcoin is the largest cryptocurrency by market capitalization, a virtual currency designed to serve as money. This form of payment cannot be controlled by any one person, group, or entity, which eliminates the need for third-party participation during financial transactions.
Altcoins are any cryptocurrency apart from Bitcoin, but some also regard Ethereum as a non-altcoin because it is from these two cryptocurrencies that forking happens. If this is true, then Litecoin is the first altcoin, forked from the Bitcoin protocol and, therefore, an “improved” version of it.
Stablecoins are cryptocurrencies designed to have a stable price, with their value backed by a reserve of the asset it represents. To achieve this, the value of any one stablecoin is pegged to a commodity or financial instrument, such as the US Dollar (USD), with its supply regulated by an algorithm or demand. The main goal of stablecoins is to provide an on/off-ramp for investors willing to trade and invest in cryptocurrencies. Stablecoins also allow investors to store value since cryptocurrencies, in general, are subject to volatility.
Bitcoin dominance is the ratio of Bitcoin's market capitalization to the total market capitalization of all cryptocurrencies combined. It provides a clear picture of Bitcoin’s interest among investors. A high BTC dominance typically happens before and during a bull run, in which investors resort to investing in relatively stable and high market capitalization cryptocurrency like Bitcoin. A drop in BTC dominance usually means that investors are moving their capital and/or profits to altcoins in a quest for higher returns, which usually triggers an explosion of altcoin rallies.
Recommended Articles


