

Ethereum Price Forecast: ETH holds near $2,500 amid derivatives weakness

Source Fxstreet

Ethereum price today: $2,480

  • Ethereum's price growth has outpaced open interest since July 1, suggesting weak conviction among long leveraged traders.
  • Withdrawals from exchanges over the past week are slightly higher than deposits, indicating a mild buying dominance in spot markets.
  • ETH has stayed put in the tight $2,431-$2,544 range.

Ethereum (ETH) holds steady near $2,500 on Wednesday amid weakness in derivatives and mild buying dominance in spot markets.

Derivatives remain calm amid mild spot buying dominance

Since the short squeeze that expanded ETH's rally toward $2,500 in late August, meaningful leverage has yet to return to support the uptrend.

Open interest measures the total worth of unsettled contracts in a derivatives market. In Ethereum futures, the metric has declined by roughly 1 million ETH since the top altcoin began a recovery in July.

In USD terms, open interest has jumped by 54% to $33.7 billion since July 1, the same period during which ETH's price rose by 58%.
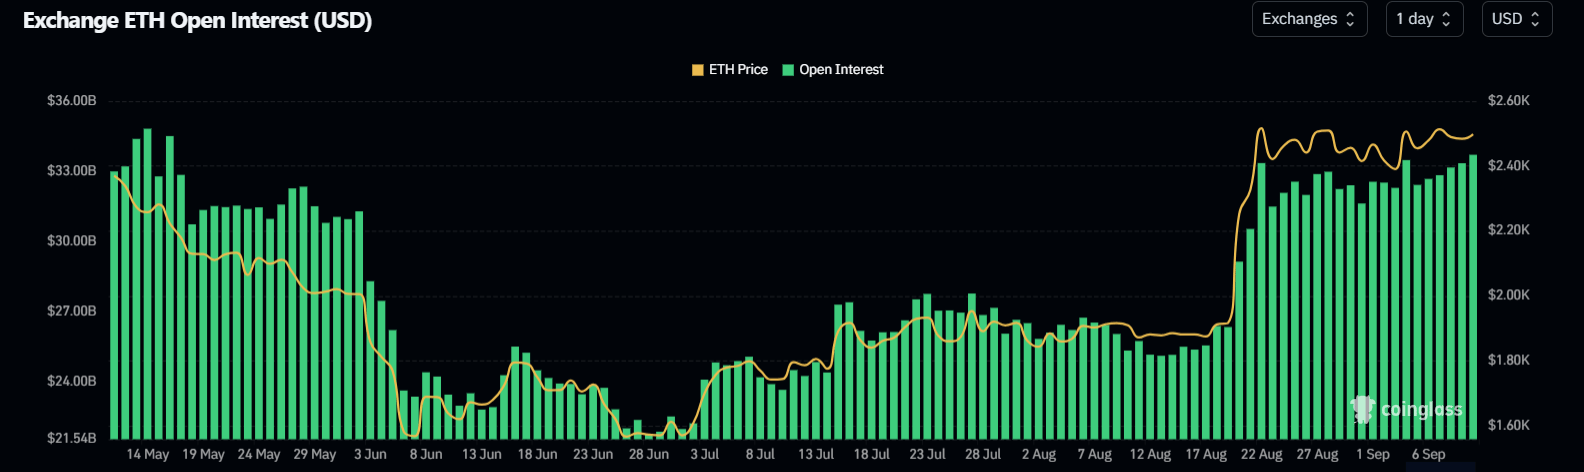
ETH Open Interest. Source: Coinglass

Price growth outpacing open interest suggests weak conviction among long leveraged traders, given the low inflow of fresh capital.

Additionally, Net Taker Volume, which measures the difference between buying and selling volume from traders executing market orders in perpetual futures, has shown negative flashes over the past few days, indicating a struggle for dominance between bulls and bears.

ETH Net Taker Volume. Source: CryptoQuant

On the spot side, ETH Exchange Netflows show withdrawals from exchanges have outpaced deposits over the past week, but at a modest pace. The move suggests buyers are mildly in control.

ETH Exchange Netflows. Source: CryptoQuant

Meanwhile, US spot ETH exchange-traded funds (ETFs) began the week on a negative footing after seeing $24.3 million in net outflows on Tuesday.

Ethereum technical outlook: ETH stays put in tight $2,431-$2,544 range

Ethereum has seen $30.6 million in liquidations over the past 24 hours, led by $15.6 million in short liquidations, according to Coinglass data.

​On the daily chart, ETH keeps a bullish near-term tone as price holds above the 20-, 50-, 100- and 200-day Exponential Moving Averages (EMAs), with the 20-day EMA at $2,403 acting as immediate dynamic support.

Momentum indicators back the constructive bias, with the 14-day Relative Strength Index (RSI) hovering in the low 60s and the Stochastic Oscillator (Stoch) also around 62, suggesting sustained but not extreme buying pressure after the recent advance.

Chart Analysis ETH/USDT (Binance)
ETH/USDT daily chart

On the downside, initial support is at the horizontal level near $2,431, followed by the clustered 20-day EMA at $2,403 and the longer-term 200-day EMA at $2,254. Deeper floors are at $2,172 and $2,111.

On the topside, ETH faces first resistance at $2,544, ahead of the next barriers at $2,626 and $2,786. A decisive break above this resistance band would open the way toward a broader continuation of the uptrend.

(The technical analysis of this story was written with the help of an AI tool. Know more.)

Disclaimer: For information purposes only. Past performance is not indicative of future results.
placeholder
US dollar clings to nine-week lows near 98.4 as Brent nears $100 and the yen hits a seven-month high — five events to watch todayThe dollar is pinned near nine-week lows even after a blockbuster jobs report, as an oil spike toward $100, a surging yen and China's reflation data crowd the driver's seat. Five key events to watch today: Brent at $99.46, USD/JPY at 154, China CPI/PPI, PBOC gold buying, and Thursday's PPI / Friday's CPI ahead of the September 15-16 FOMC.
Author  Eric Nkando
Sep 09, Wed
The dollar is pinned near nine-week lows even after a blockbuster jobs report, as an oil spike toward $100, a surging yen and China's reflation data crowd the driver's seat. Five key events to watch today: Brent at $99.46, USD/JPY at 154, China CPI/PPI, PBOC gold buying, and Thursday's PPI / Friday's CPI ahead of the September 15-16 FOMC.
placeholder
US August CPI lands tonight: after a 5.4% PPI shock, will the Fed hike on September 16?US August PPI came in at 5.4% year-on-year, above the 5.3% consensus, with core PPI at 4.6%. Traders have pushed the odds of a 25bp Fed hike on September 15-16 to around 70%. Tonight's CPI is the last major inflation print before the decision — here is the full calendar, the consensus numbers, and what a hot versus cool reading would mean for the dollar, yields, gold and stocks.
Author  Irene Q.
Sep 11, Fri
US August PPI came in at 5.4% year-on-year, above the 5.3% consensus, with core PPI at 4.6%. Traders have pushed the odds of a 25bp Fed hike on September 15-16 to around 70%. Tonight's CPI is the last major inflation print before the decision — here is the full calendar, the consensus numbers, and what a hot versus cool reading would mean for the dollar, yields, gold and stocks.
placeholder
Brent tests $108 as a key export pipeline stays shut — can the rally clear $110?Brent crude rose 2.55% to $106.97 and WTI 2.32% to $102.30 as a major regional export pipeline remained offline with no restart timeline. Front-month backwardation has widened to $5.53 from $3.84 a week ago, European gas is at its highest since December 2022, and one analyst sees $119.48 if talks stall.
Author  Irene Q.
17 hours ago
Brent crude rose 2.55% to $106.97 and WTI 2.32% to $102.30 as a major regional export pipeline remained offline with no restart timeline. Front-month backwardation has widened to $5.53 from $3.84 a week ago, European gas is at its highest since December 2022, and one analyst sees $119.48 if talks stall.
placeholder
Fed hike odds near 90% into Wednesday's decision — how to trade the dollar, gold and the S&P 500A 0.3% monthly core CPI print has lifted the market-implied probability of a 25bp Fed hike on 16 September to roughly 86.5% ~ 90%, which would be the first increase since July 2023. Here is the decision timeline, the pricing versus the forecasts, both scenarios, and the key levels for the dollar, gold and the S&P 500.
Author  Suzie
16 hours ago
A 0.3% monthly core CPI print has lifted the market-implied probability of a 25bp Fed hike on 16 September to roughly 86.5% ~ 90%, which would be the first increase since July 2023. Here is the decision timeline, the pricing versus the forecasts, both scenarios, and the key levels for the dollar, gold and the S&P 500.
placeholder
Silver Price Forecast: XAG/USD falls to near $63.50 amid Fed hike bets, higher oil pricesSilver price (XAG/USD) loses its gains from the previous day, trading around $63.50 per troy ounce during Asian hours on Monday. Non-yielding Silver is currently facing significant headwinds driven by rising Federal Reserve (Fed) rate-hike expectations for the upcoming September decision.
Author  FXStreet
14 hours ago
Silver price (XAG/USD) loses its gains from the previous day, trading around $63.50 per troy ounce during Asian hours on Monday. Non-yielding Silver is currently facing significant headwinds driven by rising Federal Reserve (Fed) rate-hike expectations for the upcoming September decision.
Related Instrument
goTop
quote