

Uniswap Price Forecast: UNI rally stretches thin amid waning retail demand

Source Fxstreet
  • Uniswap is down 2% on Thursday, capped below $6.00 after rallying over 80% in more than two weeks.
  • UNI derivatives indicate a sell-side bias, with Open Interest down 12% and around $2 million in long liquidations over the last 24 hours.
  • The technical outlook for UNI indicates a pullback bias, with momentum indicators signaling an overstretched rally.

Uniswap (UNI) is down 2% on Thursday, facing fresh selling pressure near the $6.00 mark after a steady recovery of over 80% in more than two weeks. Retail speculation is beginning to fade, with UNI futures Open Interest down 12% over the last 24 hours and a long positional wipeout of more than $2 million. The technical outlook for PI suggests a downside bias as momentum stretches thin.

Retail demand is losing strength

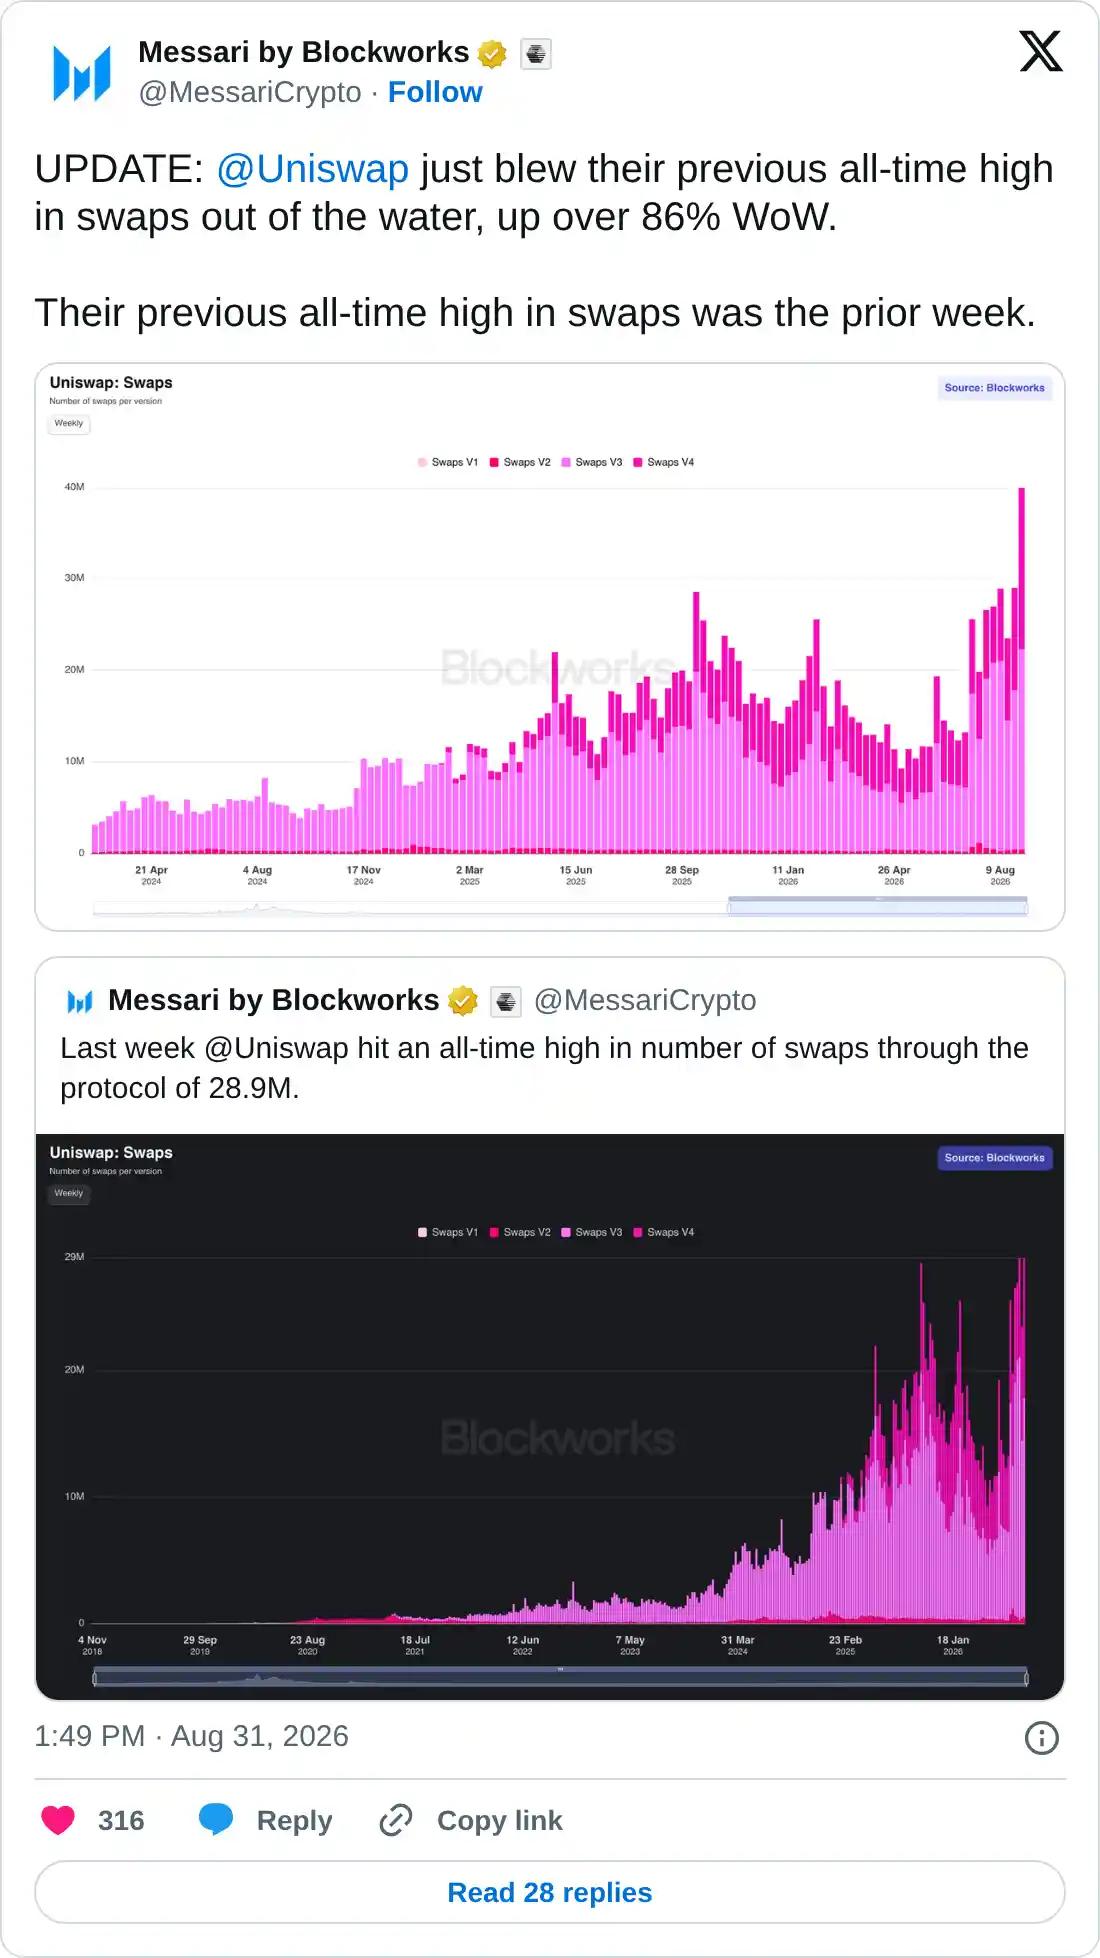
Uniswap is losing its retail strength after a steady recovery over the last 15 days, driven by strong on-chain performance. Uniswap processed another around $2 billion in Robinhood Stock Token volume in the last 2 weeks, while swaps reached a record high of 40 million last week.
https://x.com/MessariCrypto/status/2094422338360033547

CoinGlass data shows UNI Open Interest (OI) is down 12% to $480.85 million over the last 24 hours, suggesting a positional wipeout or a reduction in notional value due to the decline in the spot price. Total liquidation of $2.85 million, led by $2.15 million in long liquidation, reaffirms the unwinding of bullish positions.

Still, the OI-weighted funding rate of 0.0094% suggests that traders are inclined to take long positions at a premium despite the higher risk of liquidation, in hopes of an extended recovery.
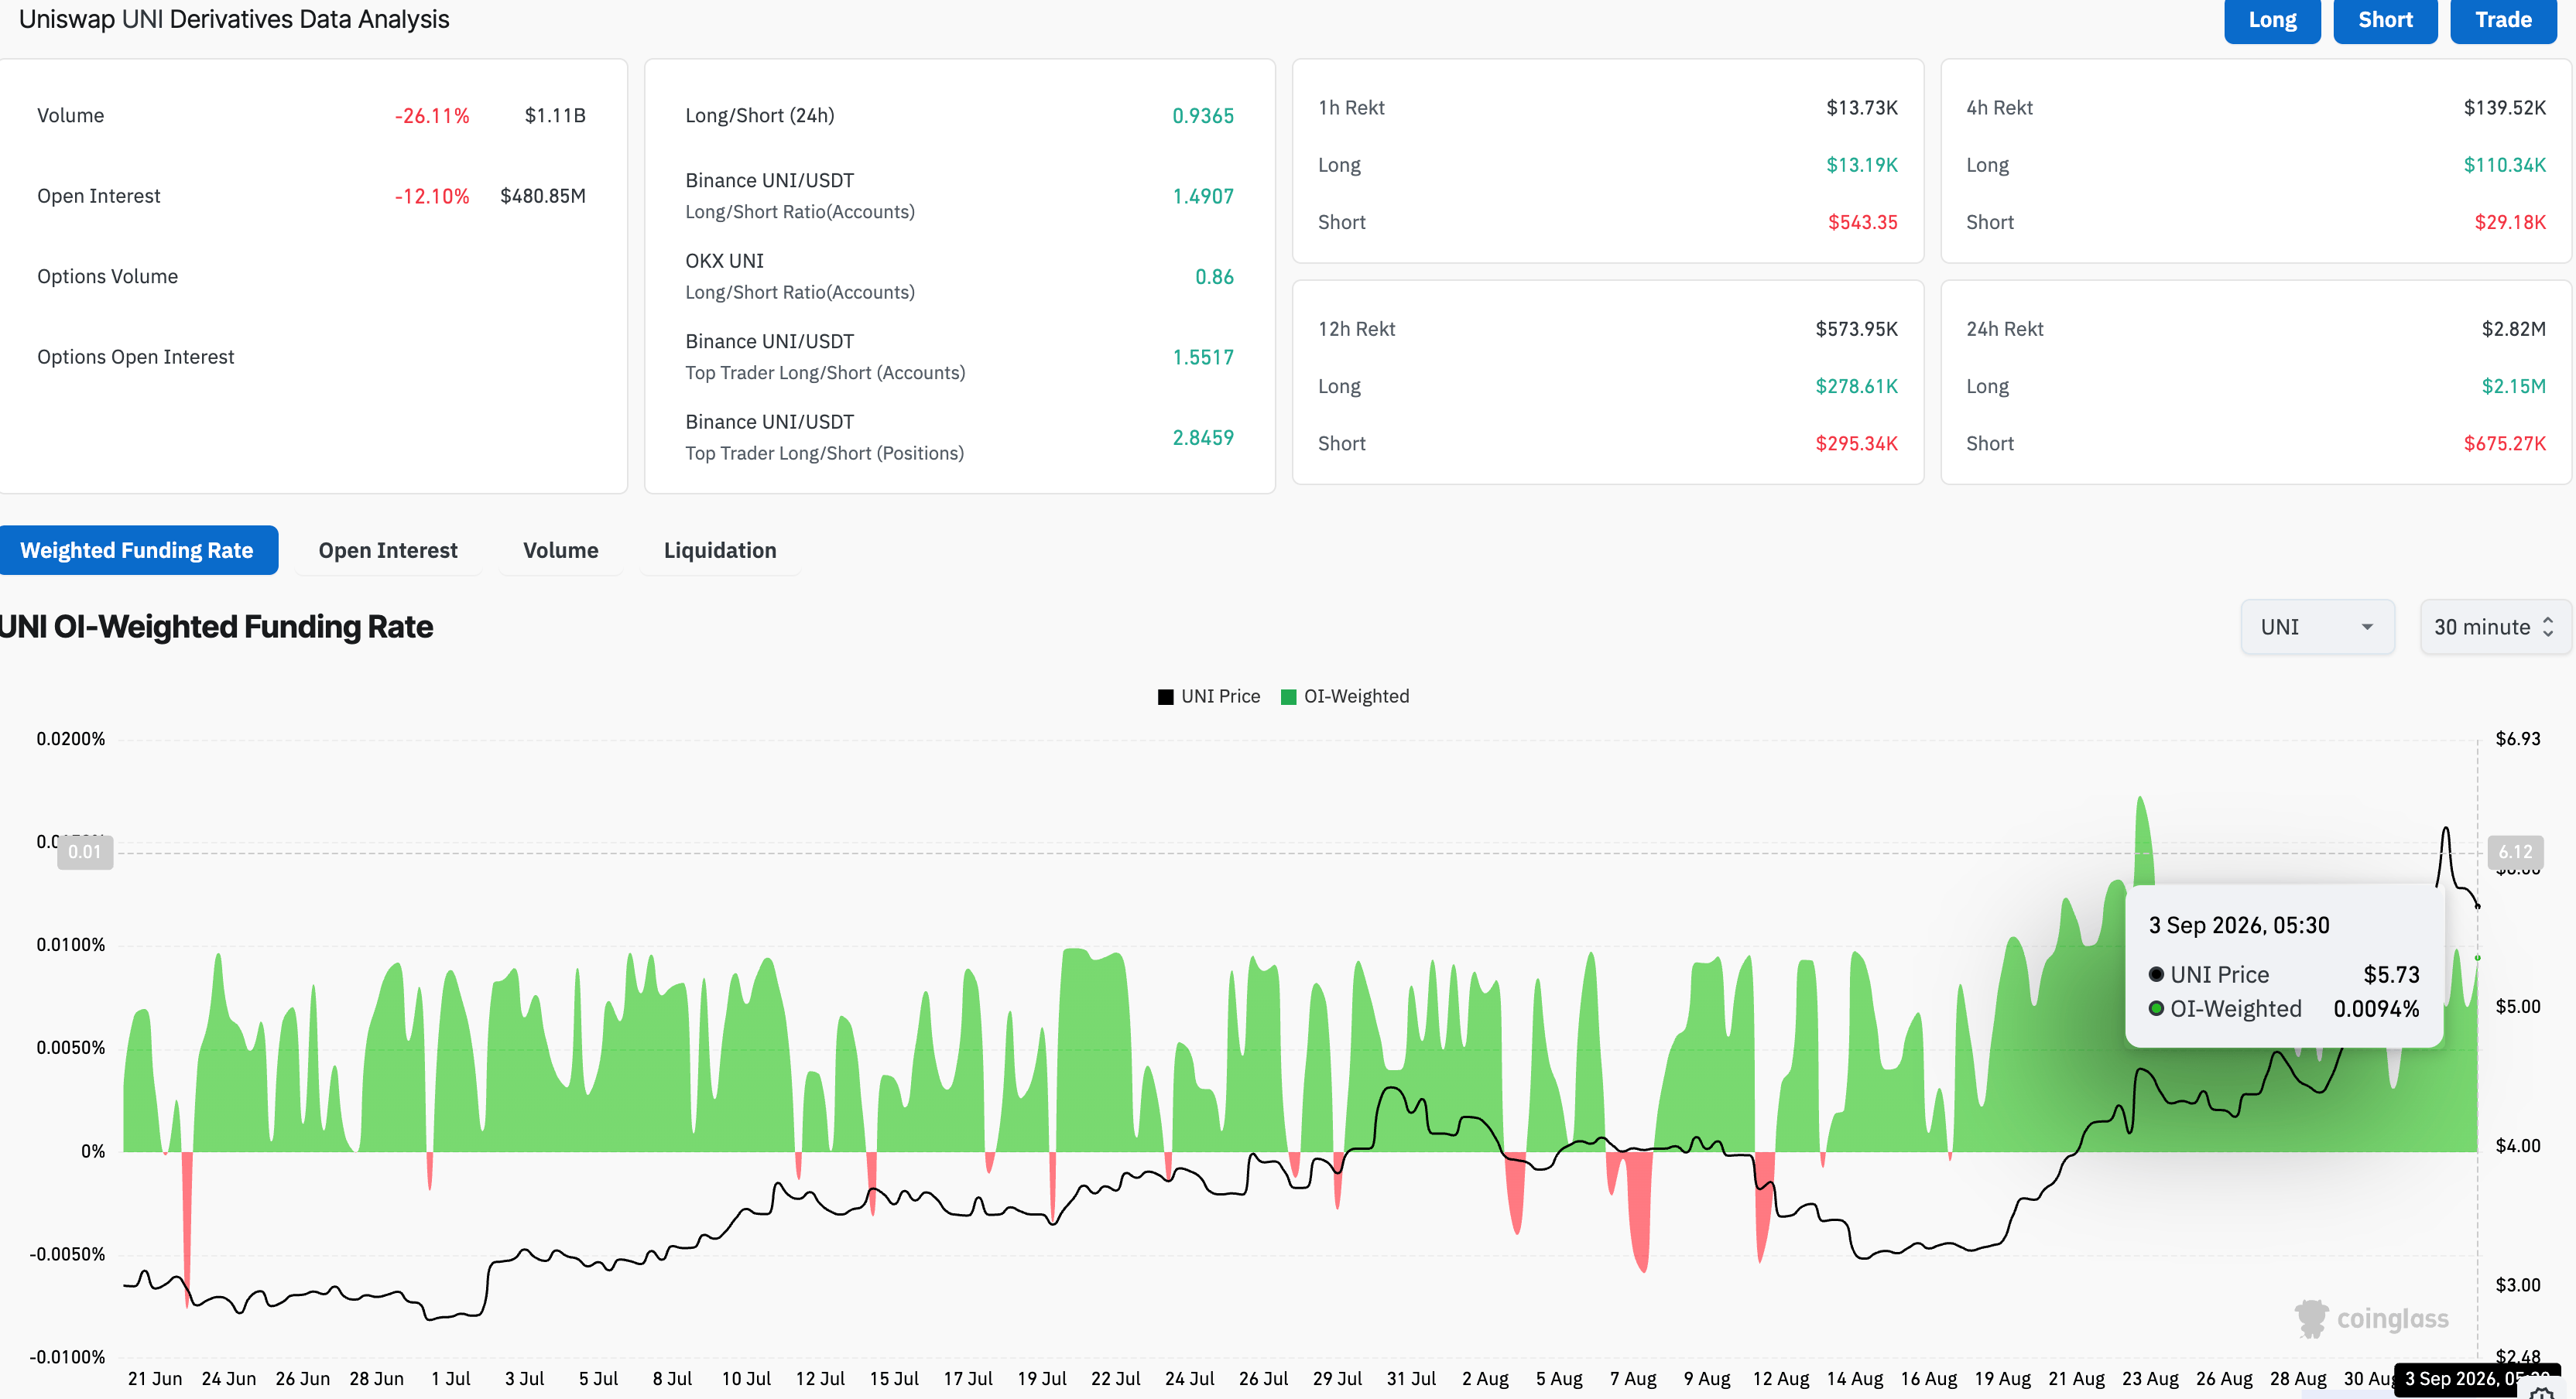
Uniswap derivatives data. Source: CoinGlass

Technical outlook: Will UNI rally extend above $6?

Uniswap trades around $5.73 at press time on Thursday, as price remains capped below the $6.00 threshold. Still, UNI maintains a bullish bias after a steady upward trend since August 15 and recording an annual high of $6.38 the previous day.

Uniswap holds well above the 50-day Exponential Moving Average (EMA) at $4.15, which crosses above the 200-day EMA at $3.98, marking a Golden Cross patten, which supports the uptrend and signals bullish trend reversal.

From a technical perspective, a confirmed breakout above the R1 Pivot Point at $6.09 could target the overhead R2 and R2 Pivot levels at $6.95 and $8.41, respectively. Momentum remains constructive on the daily chart, with the Moving Average Convergence Divergence (MACD) holding above its signal line, while the Relative Strength Index (RSI) at 74 flags overbought conditions.

Chart Analysis UNI/USDT (Binance)
UNI/USDT daily price chart.

On the downside, initial technical support is seen at the recent breakout area around the broken resistance trendline near $4.74, followed by the 50-day EMA at $4.15 where dip-buying interest could re-emerge if a pullback develops.

(The technical analysis of this story was written with the help of an AI tool. Know more.)

Disclaimer: For information purposes only. Past performance is not indicative of future results.
placeholder
US September CPI preview: inflation set to hit 3.7% — will the Fed hike in December?US September CPI lands Wednesday with headline inflation seen at 3.7% y/y and core at 0.2% m/m. December hike odds sit near 70% — here are the scenarios, the calendar and the key levels.
Author  Irene Q.
Oct 10, Sat
US September CPI lands Wednesday with headline inflation seen at 3.7% y/y and core at 0.2% m/m. December hike odds sit near 70% — here are the scenarios, the calendar and the key levels.
placeholder
Yen inches toward 159 as Tokyo reopens — where is the line in the sand before 160?USD/JPY traded around 158.5 on Tuesday after Monday's 158.60 close — the highest since September 24 — as Tokyo reopened and the market re-focused on two dates dominating the yen calendar: the G20 finance ministers' meeting in Bangkok on October 15 and the Bank of Japan's October 30 decision. Here are the three forces leaning on the yen, the positioning picture, and the scenarios into Wednesday's US CPI.
Author  Irene Q.
Oct 13, Tue
USD/JPY traded around 158.5 on Tuesday after Monday's 158.60 close — the highest since September 24 — as Tokyo reopened and the market re-focused on two dates dominating the yen calendar: the G20 finance ministers' meeting in Bangkok on October 15 and the Bank of Japan's October 30 decision. Here are the three forces leaning on the yen, the positioning picture, and the scenarios into Wednesday's US CPI.
placeholder
Strong profits, falling shares: bank earnings day one meets a memory-chip rout — with CPI and ASML aheadGoldman Sachs blew past estimates (EPS $17.01 vs $13.09 expected, profit +33%) while JPMorgan missed ($5.75 vs $5.93) and Wells Fargo fell 3% — yet the S&P 500 finished flat at 7,805.45, pinned below its record close as a memory-chip rout (SOX −2.67%, Micron under $1,000) kept the pressure on. Tonight brings the week's decider: US September CPI at 8:30 ET, then Bank of America, Morgan Stanley, BlackRock and ASML before the open. Here are the levels, both cases, and the watch list.
Author  Irene Q.
Yesterday 06: 06
Goldman Sachs blew past estimates (EPS $17.01 vs $13.09 expected, profit +33%) while JPMorgan missed ($5.75 vs $5.93) and Wells Fargo fell 3% — yet the S&P 500 finished flat at 7,805.45, pinned below its record close as a memory-chip rout (SOX −2.67%, Micron under $1,000) kept the pressure on. Tonight brings the week's decider: US September CPI at 8:30 ET, then Bank of America, Morgan Stanley, BlackRock and ASML before the open. Here are the levels, both cases, and the watch list.
placeholder
Bitcoin's V-shaped rebound: from $80,953 back above $83,000 — spot buyers step in as the Fed softens, but ETF outflows lingerBitcoin slid to $80,953 on October 13 — then snapped back above $83,000, reclaiming the 81,847–82,305 'golden zone' on spot-led buying as Williams and Waller cooled the Fed's hawkish tone and the dollar pulled back from its 18-month high. But October ETF outflows near $386 million and a fear-and-greed reading of 56 say the repair is unfinished. Here are the levels, the transmission chain and both cases ahead of tonight's US CPI.
Author  Suzie
23 hours ago
Bitcoin slid to $80,953 on October 13 — then snapped back above $83,000, reclaiming the 81,847–82,305 'golden zone' on spot-led buying as Williams and Waller cooled the Fed's hawkish tone and the dollar pulled back from its 18-month high. But October ETF outflows near $386 million and a fear-and-greed reading of 56 say the repair is unfinished. Here are the levels, the transmission chain and both cases ahead of tonight's US CPI.
placeholder
Gold Price Analysis Today | Forex Gold Analysis | XAU/USD Analysis - October 14, 2026Get the latest gold price analysis, forex gold insights, and XAU/USD analysis for October 14, 2026. Read on for the details.
Author  Mitrade
23 hours ago
Get the latest gold price analysis, forex gold insights, and XAU/USD analysis for October 14, 2026. Read on for the details.
Related Instrument
goTop
quote