

Dogecoin Price Forecast: DOGE rebound builds momentum

Source Fxstreet
  • Dogecoin is gaining momentum on Tuesday as the broader crypto market rebounds.
  • The Dogecoin derivatives market shows signs of steady growth as futures Open Interest climbs to 15.45 billion DOGE.
  • A break above the $0.075 supply level is required to steady the meme coin’s upswing and support a move toward the 50-day EMA.

Dogecoin (DOGE) rises alongside other cryptocurrencies on Tuesday, trading around $0.0734. The largest meme coin eyes a short-term breakout, supported by a steadily growing derivatives market.

Still, investors should assess the overall outlook, especially amid persistent strikes between the United States (US) and Iran that are denting market sentiment.

The Fear & Greed Index has dipped to 25 on Tuesday, placing market sentiment firmly in Extreme Fear territory, down from 29 the day before. If recovery lags and negatively impacts appetite for risk assets, Dogecoin’s ongoing rebound may lose steam.
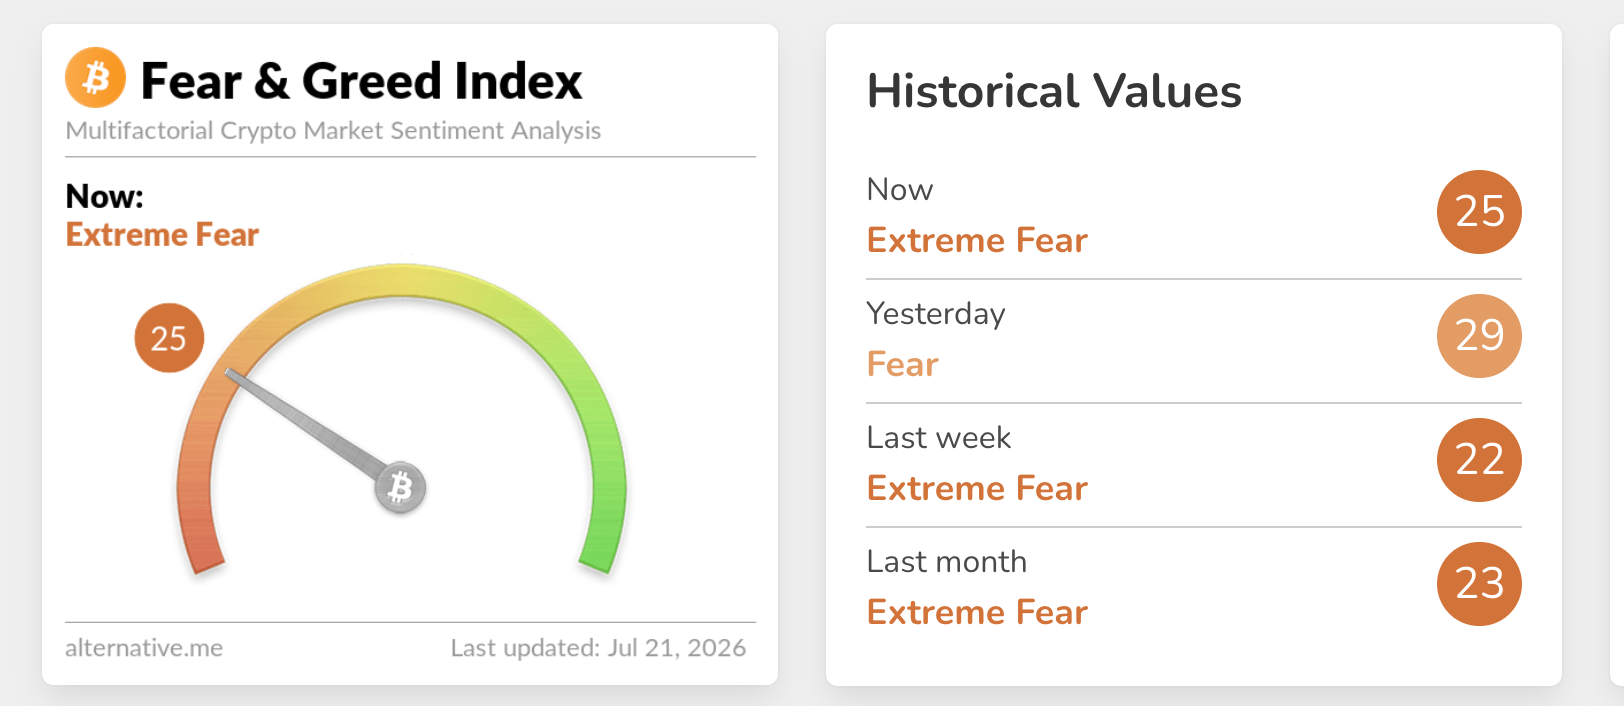
Crypto Fear & Greed Index | Source: Alternative

Dogecoin retail demand returns

Dogecoin derivatives continues to regain momentum with futures Open Interest (OI) rising to 15.43 billion DOGE on Tuesday, from 14.64 billion DOGE. A broader scope highlights the growth in OI from 12.01 billion DOGE on June 11, underscoring increasing investor interest in the meme coin.
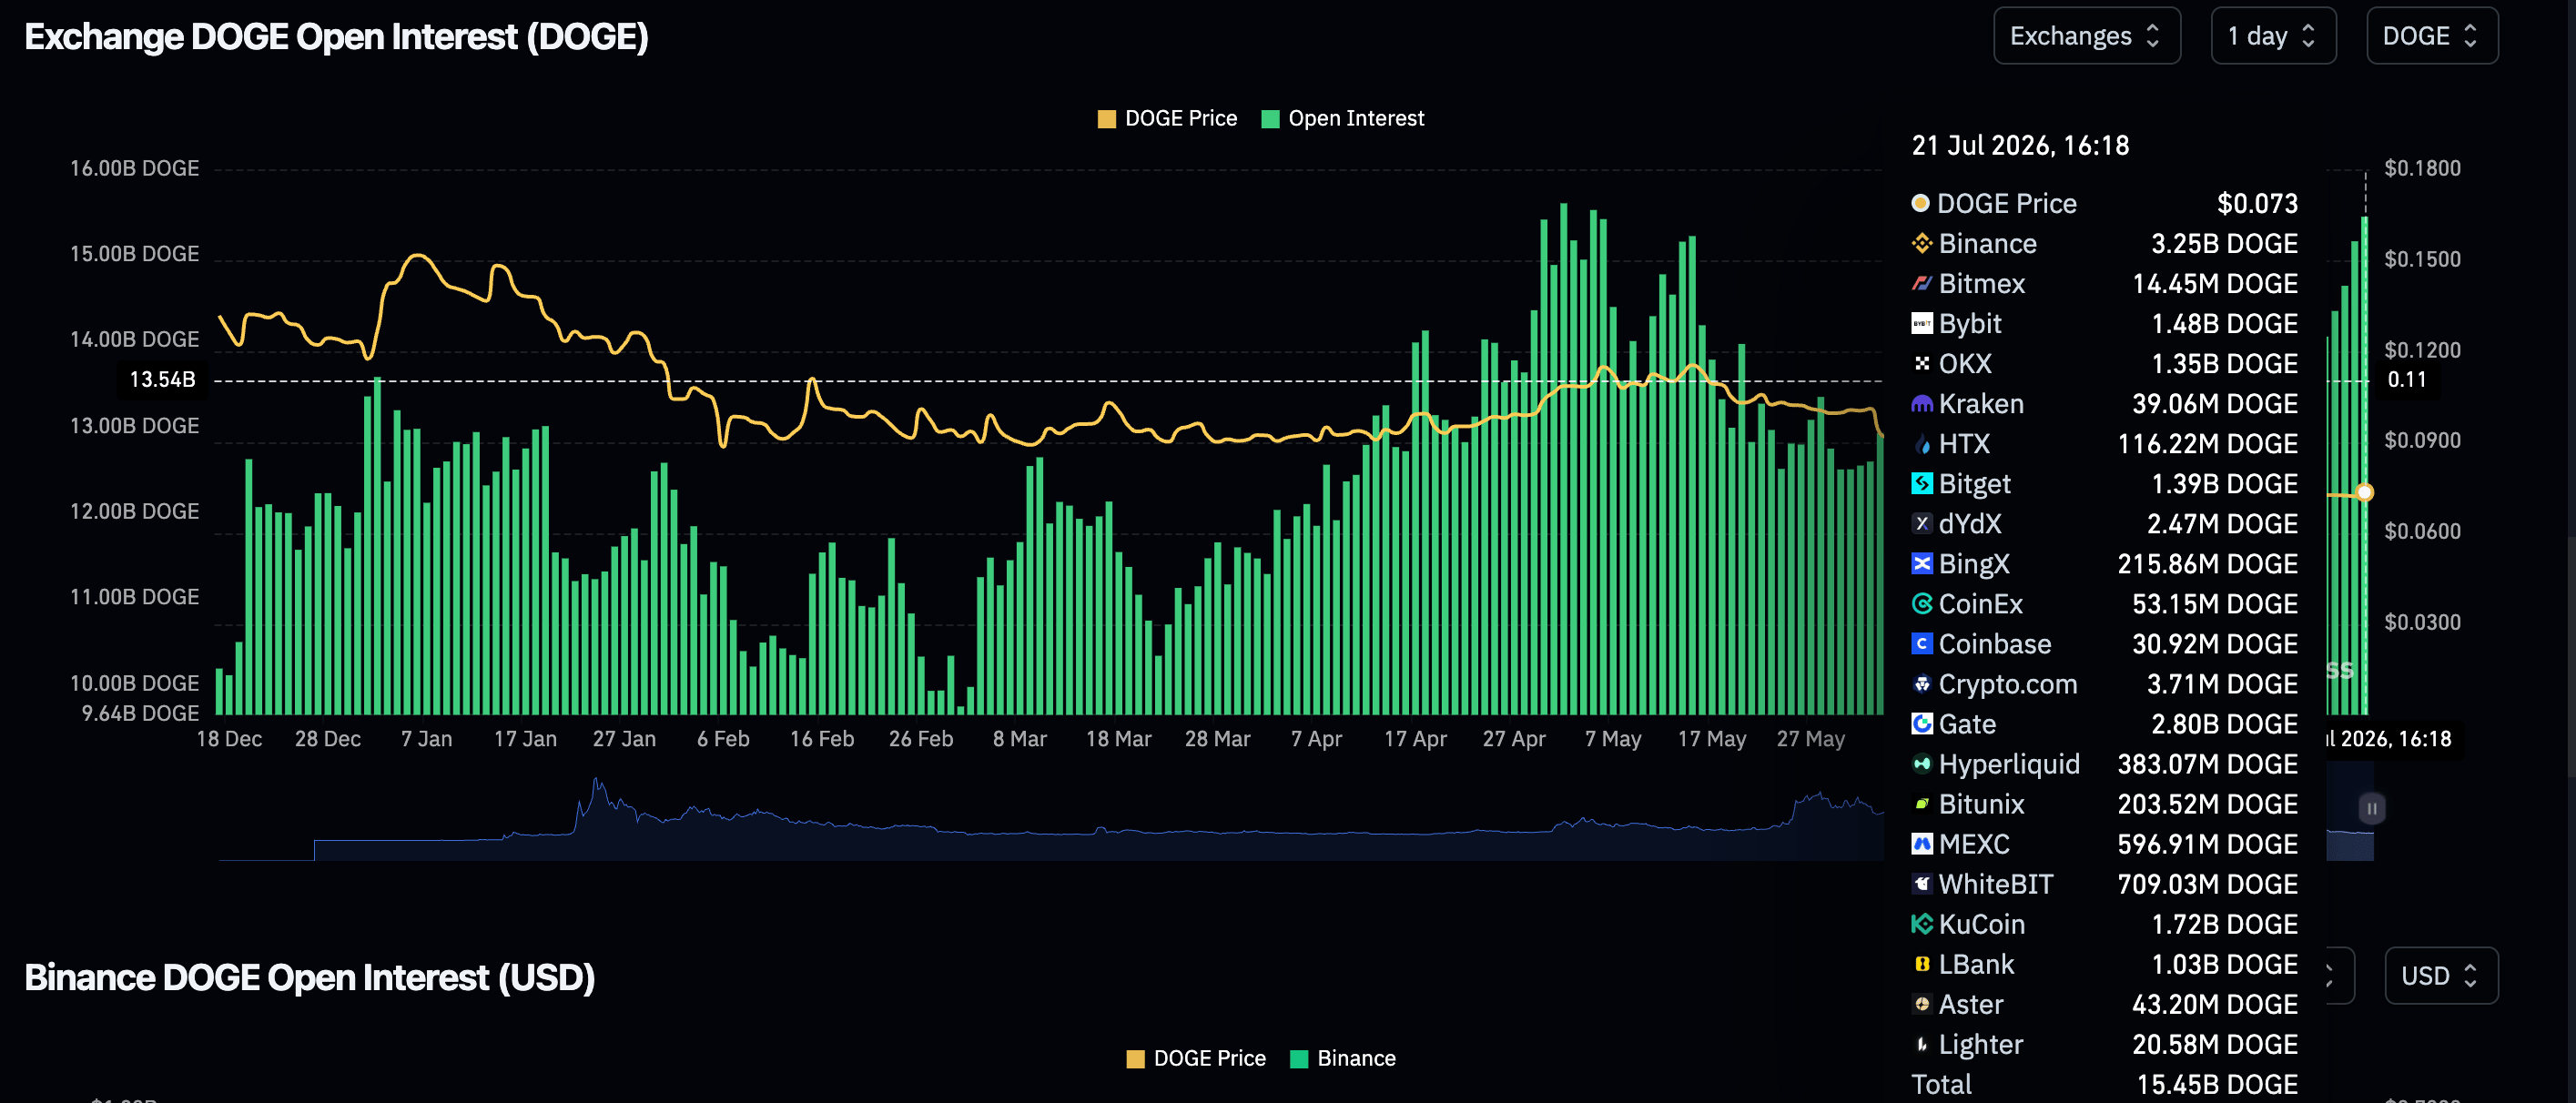
Dogecoin Futures OI | Source: CoinGlass

Meanwhile, trading volume has more than doubled to $1.02 billion from $438 million the day before and $336 million last Sunday, reinforcing the positive change in the derivatives market.
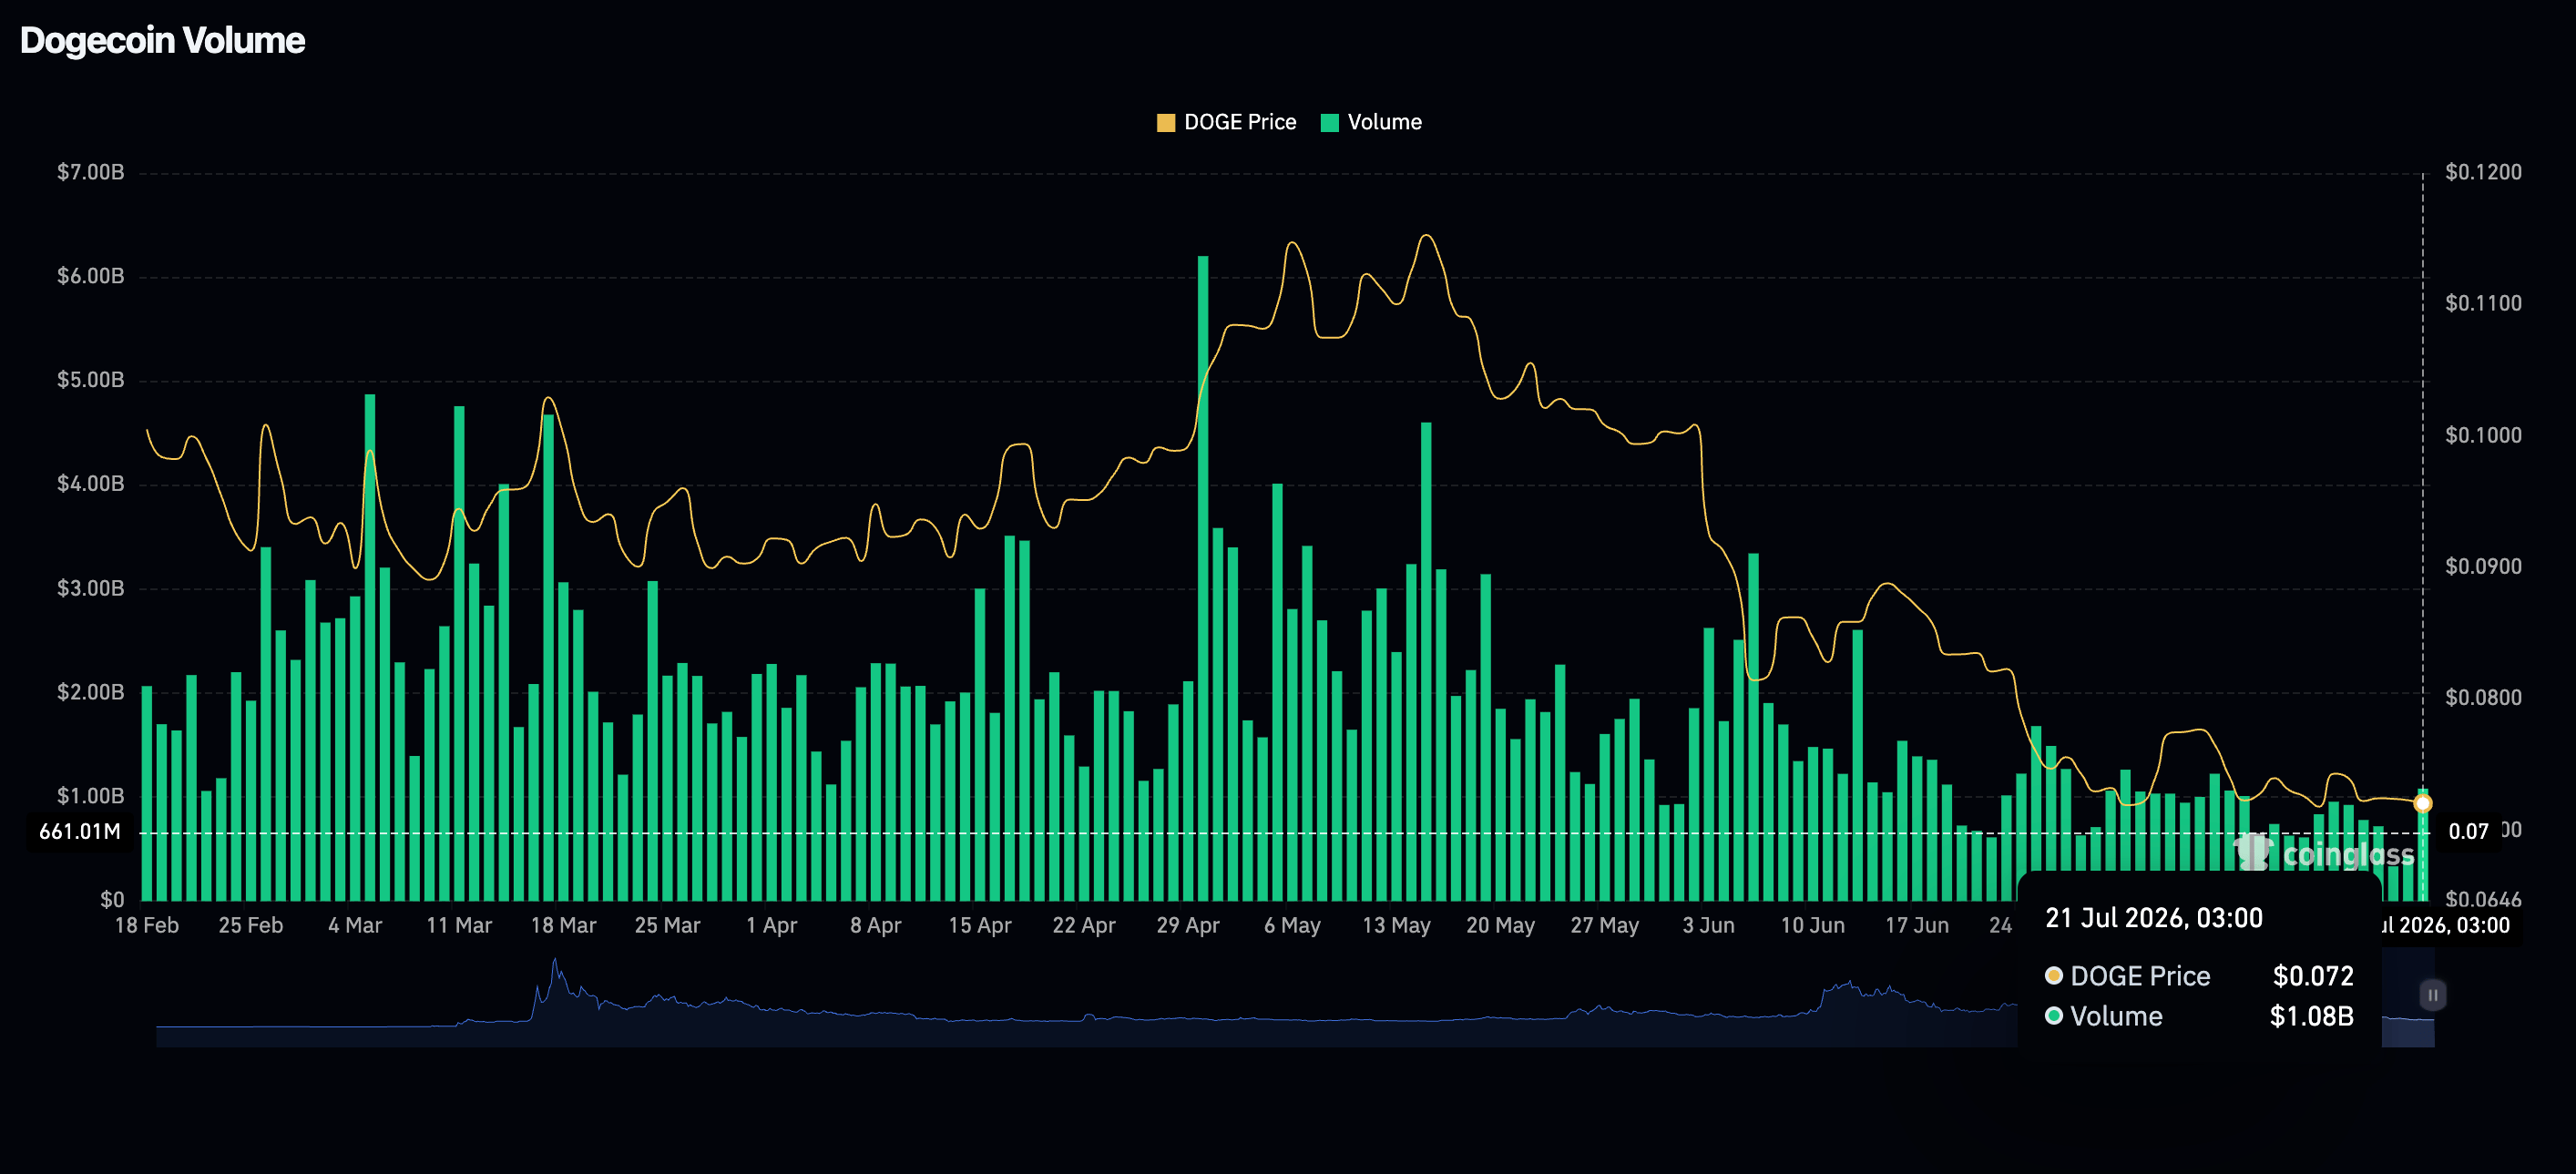
Dogecoin volume | Source: CoinGlass

Price analysis: Dogecoin ticks up amid a broader bearish outlook

Dogecoin trades at $0.0734 after a brief increase on the day. However, the meme coin retains a bearish near-term bias as price remains well below the 50-day, 100-day and 200-day Exponential Moving Averages (EMAs) at $0.0798, $0.0877 and $0.1047, respectively. The pair has reclaimed the former downward trendline barrier around $0.0709, which now acts as underlying support.

Meanwhile, the Relative Strength Index (RSI) near 43 and a mildly positive Moving Average Convergence Divergence (MACD) reading only hint at tentative stabilization rather than a clear bullish shift.

DOGE/USDT daily chart

Initial resistance lies at the 50-day EMA at $0.0798, ahead of the 100-day EMA at $0.0877, with the longer-term 200-day EMA at $0.1047 reinforcing a broader bearish structure as long as DOGE trades beneath it. On the downside, the first notable support aligns with the trendline break level at $0.0709. A daily close below that floor would reopen the path toward fresh lows, while holding above it keeps the pair in a sideways-to-softly bearish consolidation under the key moving average cluster.

(The technical analysis of this story was written with the help of an AI tool. Know more.)

Open Interest, funding rate FAQs

Higher Open Interest is associated with higher liquidity and new capital inflow to the market. This is considered the equivalent of increase in efficiency and the ongoing trend continues. When Open Interest decreases, it is considered a sign of liquidation in the market, investors are leaving and the overall demand for an asset is on a decline, fueling a bearish sentiment among investors.

Funding fees bridge the difference between spot prices and prices of futures contracts of an asset by increasing liquidation risks faced by traders. A consistently high and positive funding rate implies there is a bullish sentiment among market participants and there is an expectation of a price hike. A consistently negative funding rate for an asset implies a bearish sentiment, indicating that traders expect the cryptocurrency’s price to fall and a bearish trend reversal is likely to occur.

Disclaimer: For information purposes only. Past performance is not indicative of future results.
placeholder
Gold ends three-week slide at the $4,400 line — eight straight days of ETF inflows vs a 5% 10-year and a 100 dollarSpot gold closed Friday at $4,378.39, up 0.84% on the day and about 0.8% for the week — its first weekly gain in four weeks — with the intraday high of $4,399.67 leaving it 33 cents shy of the $4,400 line. Gold ETFs have now logged eight straight sessions of inflows, but with the 10-year back above 5% and the dollar index near 100, here is what decides whether this is a reversal or a bounce.
Author  Suzie
Sep 20, Sun
Spot gold closed Friday at $4,378.39, up 0.84% on the day and about 0.8% for the week — its first weekly gain in four weeks — with the intraday high of $4,399.67 leaving it 33 cents shy of the $4,400 line. Gold ETFs have now logged eight straight sessions of inflows, but with the 10-year back above 5% and the dollar index near 100, here is what decides whether this is a reversal or a bounce.
placeholder
October hike odds climb toward 60% as Goldman and BofA both flip — what Warsh's "dose of accommodation" really changedRate futures now price roughly 55% to 62% for a 25bp hike at the October 27-28 FOMC, up from about 30% before Chair Warsh's post-meeting framing that the Fed is merely "removing some accommodation." Goldman Sachs has added an October hike to its forecast and Bank of America now sees moves in both October and December. Here is the repricing, the language behind it, and the two data points that decide it.
Author  Irene Q.
Sep 23, Wed
Rate futures now price roughly 55% to 62% for a 25bp hike at the October 27-28 FOMC, up from about 30% before Chair Warsh's post-meeting framing that the Fed is merely "removing some accommodation." Goldman Sachs has added an October hike to its forecast and Bank of America now sees moves in both October and December. Here is the repricing, the language behind it, and the two data points that decide it.
placeholder
Gold holds steady below $4,150 amid elevated US yields Gold price (XAU/USD) trades on a flat note near $4,140 during the early Asian session on Tuesday. Pressure from a stronger US Dollar (USD) and elevated US Treasury yields was offset by reduced expectations of a Federal Reserve (Fed) rate hike this month.
Author  FXStreet
Oct 06, Tue
Gold price (XAU/USD) trades on a flat note near $4,140 during the early Asian session on Tuesday. Pressure from a stronger US Dollar (USD) and elevated US Treasury yields was offset by reduced expectations of a Federal Reserve (Fed) rate hike this month.
placeholder
WTI rises to near $89.50 as Middle East supply threats offset Persian Gulf recoveryWest Texas Intermediate (WTI) oil price extends its gains for the second successive day, trading around $89.50 per barrel during the Asian hours on Wednesday. Crude oil climbed as persistent risks to Middle East energy flows overshadowed signs of rising supply from the region.
Author  FXStreet
Yesterday 01: 26
West Texas Intermediate (WTI) oil price extends its gains for the second successive day, trading around $89.50 per barrel during the Asian hours on Wednesday. Crude oil climbed as persistent risks to Middle East energy flows overshadowed signs of rising supply from the region.
placeholder
Gold Price Forecast: XAU/USD retraces gains and nears two-month lows at $4,104Gold (XAU/USD) retraces Tuesday’s gains on Wednesday and resumes its broader bearish trend, with the US Dollar (USD) appreciating across the board, as investors brace for the release of the minutes of the latest Federal Reserve (Fed) meeting.
Author  FXStreet
16 hours ago
Gold (XAU/USD) retraces Tuesday’s gains on Wednesday and resumes its broader bearish trend, with the US Dollar (USD) appreciating across the board, as investors brace for the release of the minutes of the latest Federal Reserve (Fed) meeting.
Related Instrument
goTop
quote