


Cardano Price Forecast: Bearish flag pattern in ADA signals 14% downside risk
- Cardano hovers around $0.1700 on Wednesday, close to a local support trendline after two consecutive days of losses.
- Retail activity in ADA derivatives grows bearish, with volume and the funding rate declining while Open Interest rises.
- The technical outlook for ADA is bearish, with a risk of a 14% drop to below $0.1500.
Cardano (ADA) price hovers above $0.1700 at press time on Wednesday, but the two consecutive days of losses cap the momentum in its short-term recovery. The pullback weighs down on the retail sentiment and forms a bearish flag pattern, with a 14% downside risk toward the June 6 low at $0.1486.
Risk-off sentiment rises in ADA derivatives
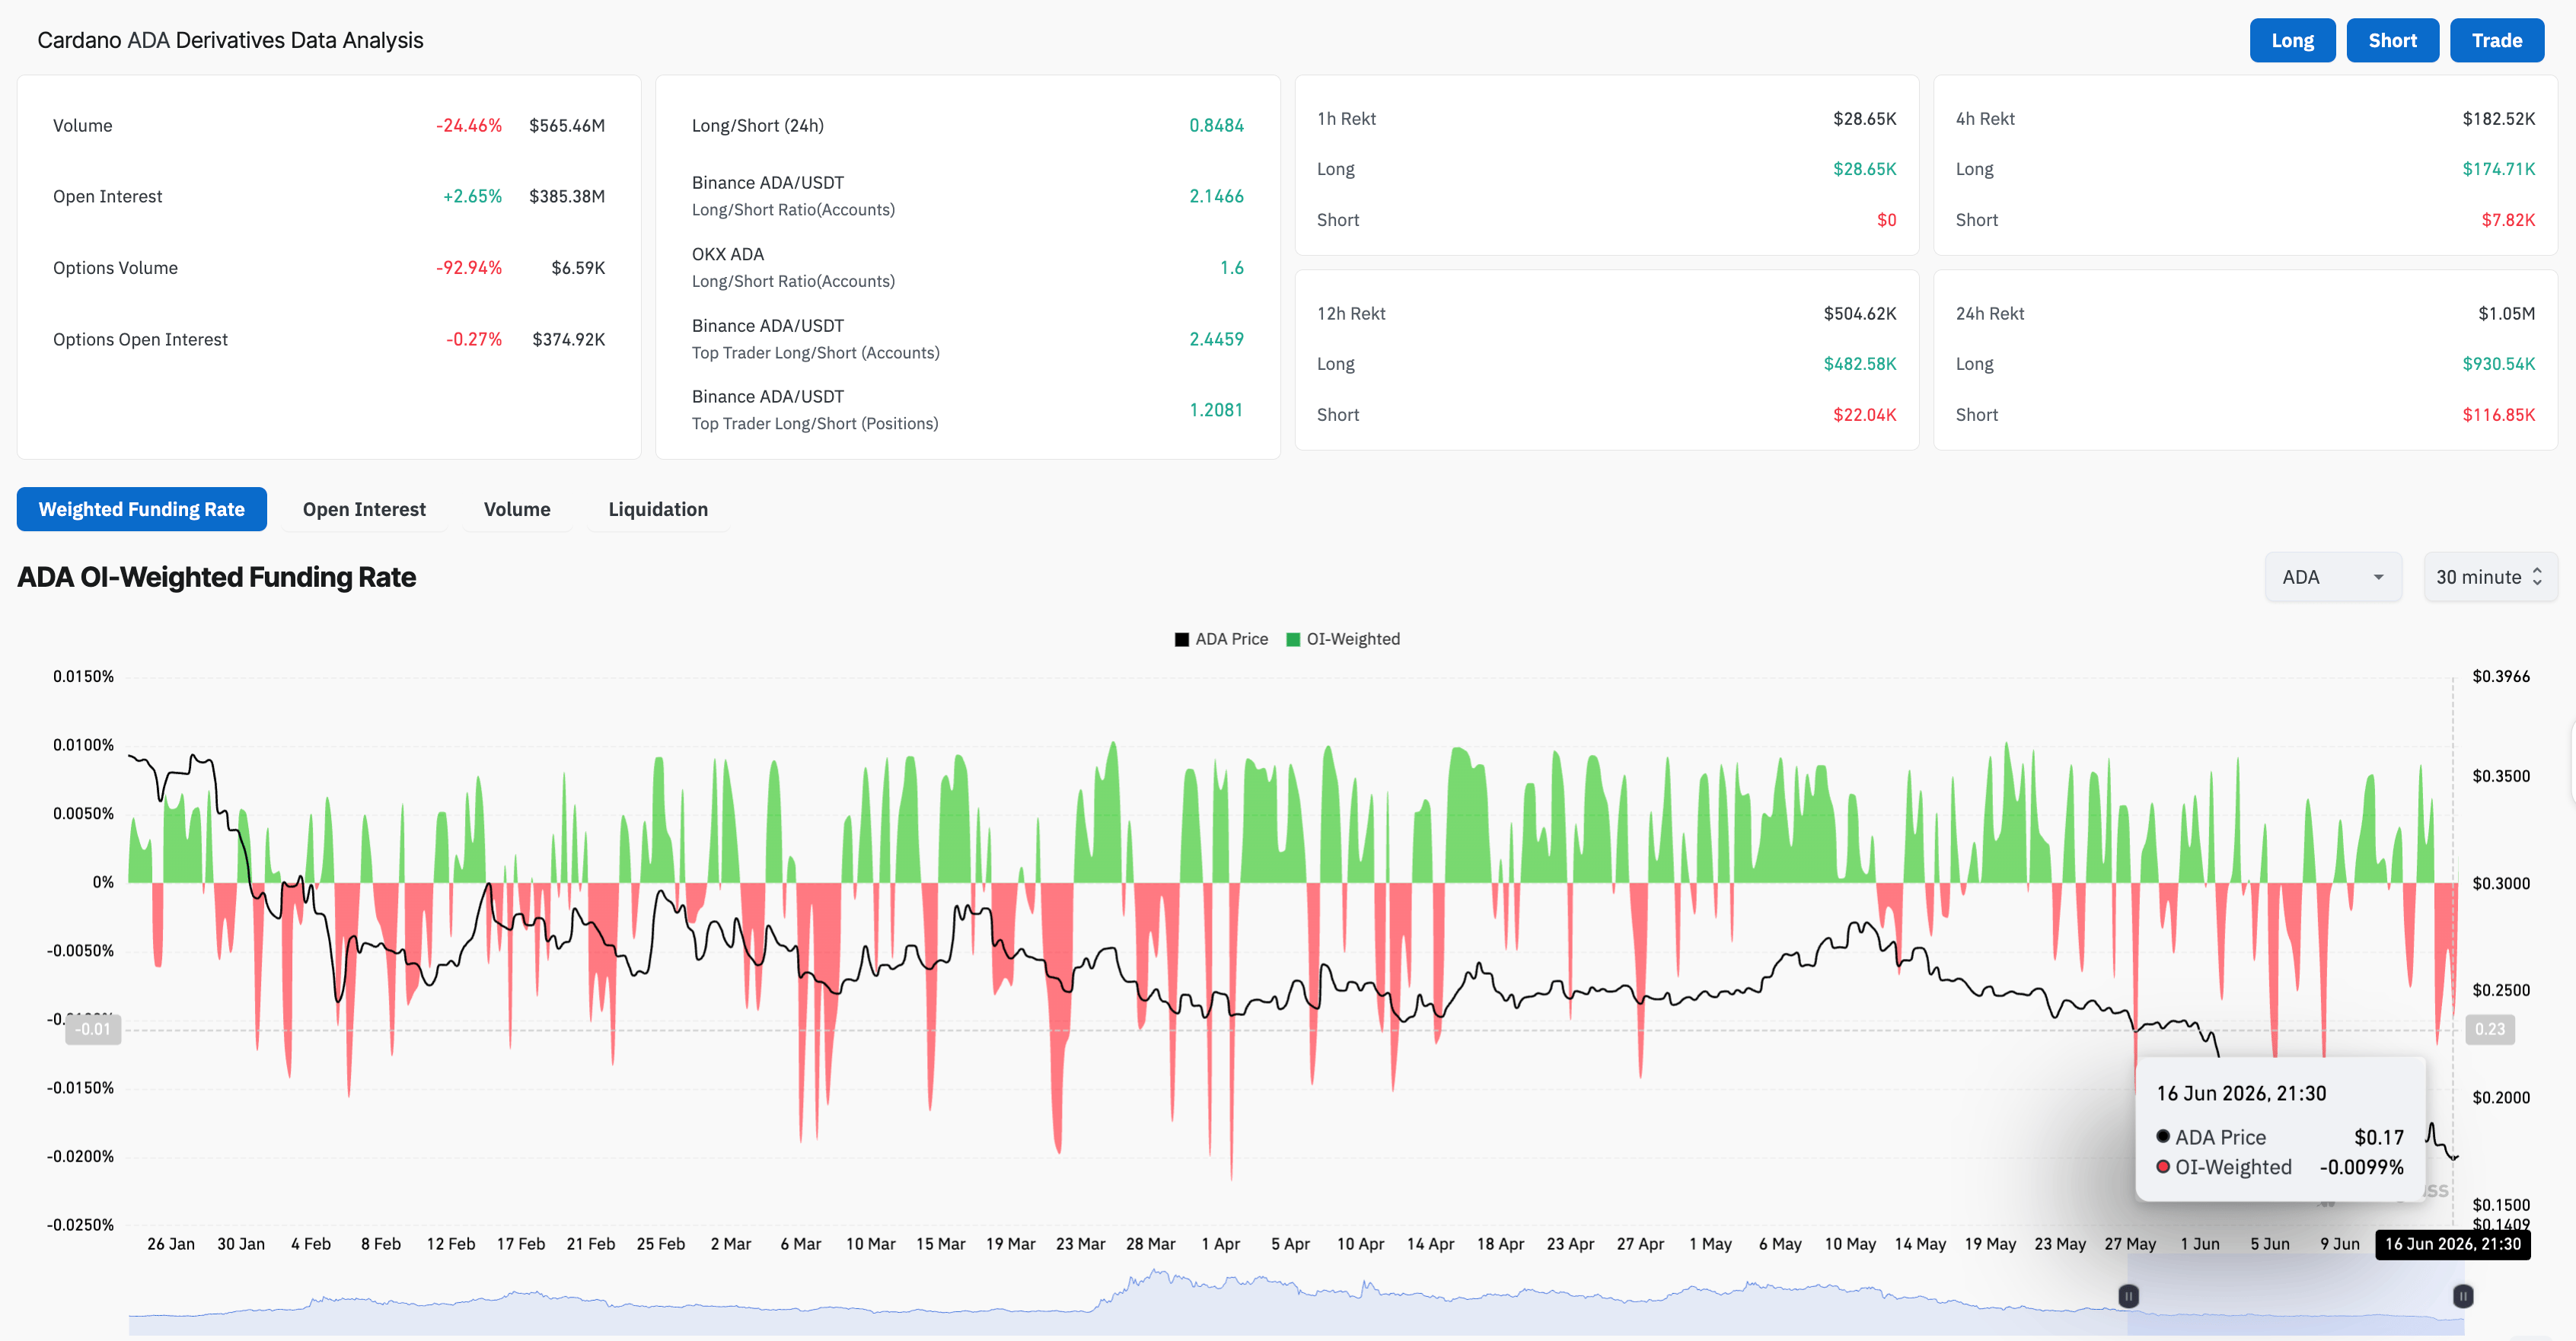
Retail strength in Cardano has been declining over the past few weeks amid concerns about network utility, ecosystem growth, and founder Charles Hoskinson’s posts about his responsibilities and his break from social media. CoinGlass data show that the volume in ADA derivatives has dropped by roughly 25% in the last 24 hours to $565.46 million, while Open Interest (OI) is up almost 3% to $385.38 million. Typically, an inverse relation in OI and volume suggests a quiet positional buildup in the market.
The negative funding rate of -0.0099% – indicating traders are willing to buy short positions for a premium– confirms a heavy bearish buildup in ADA derivatives. In short, ADA derivatives data reflects a bearish crowding or crowded-shorts scenario.
Technical outlook: Will Cardano price drop below $0.1500?
Cardano trades around $0.1700 at press time on Wednesday, maintaining a broadly bearish bias on the 4-hour chart. ADA price holds beneath the 50-period Exponential Moving Average (EMA) at $0.1752 is the first cap above spot, with the 100-period EMA at $0.1845 and the 200-period EMA at $0.2035 reinforcing the broader downside bias.
From a technical perspective, ADA price hovers near the local support trendline of a short-term rising channel pattern around $0.1700. However, the channel completes a bearish flag pattern with the 30% drop in early June acting as the pole.
That said, the Relative Strength Index (RSI) hovers just below the midline near 47 on the 4-hour chart, while the Moving Average Convergence Divergence (MACD) remains below its signal line, following a bearish trajectory. Taken together, the momentum indicators suggest that recovery attempts are likely to encounter selling pressure while the price remains below these key EMAs.
A decisive close below $0.1700 could confirm a bearish breakout of the inverted flag pattern, shifting attention to lower support levels. The 78.6% and 100% Fibonacci levels, measured over the 30% drop in early June, at $0.1644 and $0.1486, serve as crucial bases, with the latter signaling a potential 14% downside from the current market price. The 127.2% Fibonacci extension level at $0.1306 emerges as the extended bearish price target.
Looking up, a potential rebound in ADA price could test the 50- and 100-period EMAs at $0.1752 and $0.1845, respectively, followed by the 50% retracement level at $0.1883.
(The technical analysis of this story was written with the help of an AI tool.)
Cryptocurrency metrics FAQs
The developer or creator of each cryptocurrency decides on the total number of tokens that can be minted or issued. Only a certain number of these assets can be minted by mining, staking or other mechanisms. This is defined by the algorithm of the underlying blockchain technology. On the other hand, circulating supply can also be decreased via actions such as burning tokens, or mistakenly sending assets to addresses of other incompatible blockchains.
Market capitalization is the result of multiplying the circulating supply of a certain asset by the asset’s current market value.
Trading volume refers to the total number of tokens for a specific asset that has been transacted or exchanged between buyers and sellers within set trading hours, for example, 24 hours. It is used to gauge market sentiment, this metric combines all volumes on centralized exchanges and decentralized exchanges. Increasing trading volume often denotes the demand for a certain asset as more people are buying and selling the cryptocurrency.
Funding rates are a concept designed to encourage traders to take positions and ensure perpetual contract prices match spot markets. It defines a mechanism by exchanges to ensure that future prices and index prices periodic payments regularly converge. When the funding rate is positive, the price of the perpetual contract is higher than the mark price. This means traders who are bullish and have opened long positions pay traders who are in short positions. On the other hand, a negative funding rate means perpetual prices are below the mark price, and hence traders with short positions pay traders who have opened long positions.
Recommended Articles


