

Uniswap Price Forecast: UNI rebounds as retail interest cools
- Uniswap rises by over 7% intraday as US inflation comes in softer than expected.
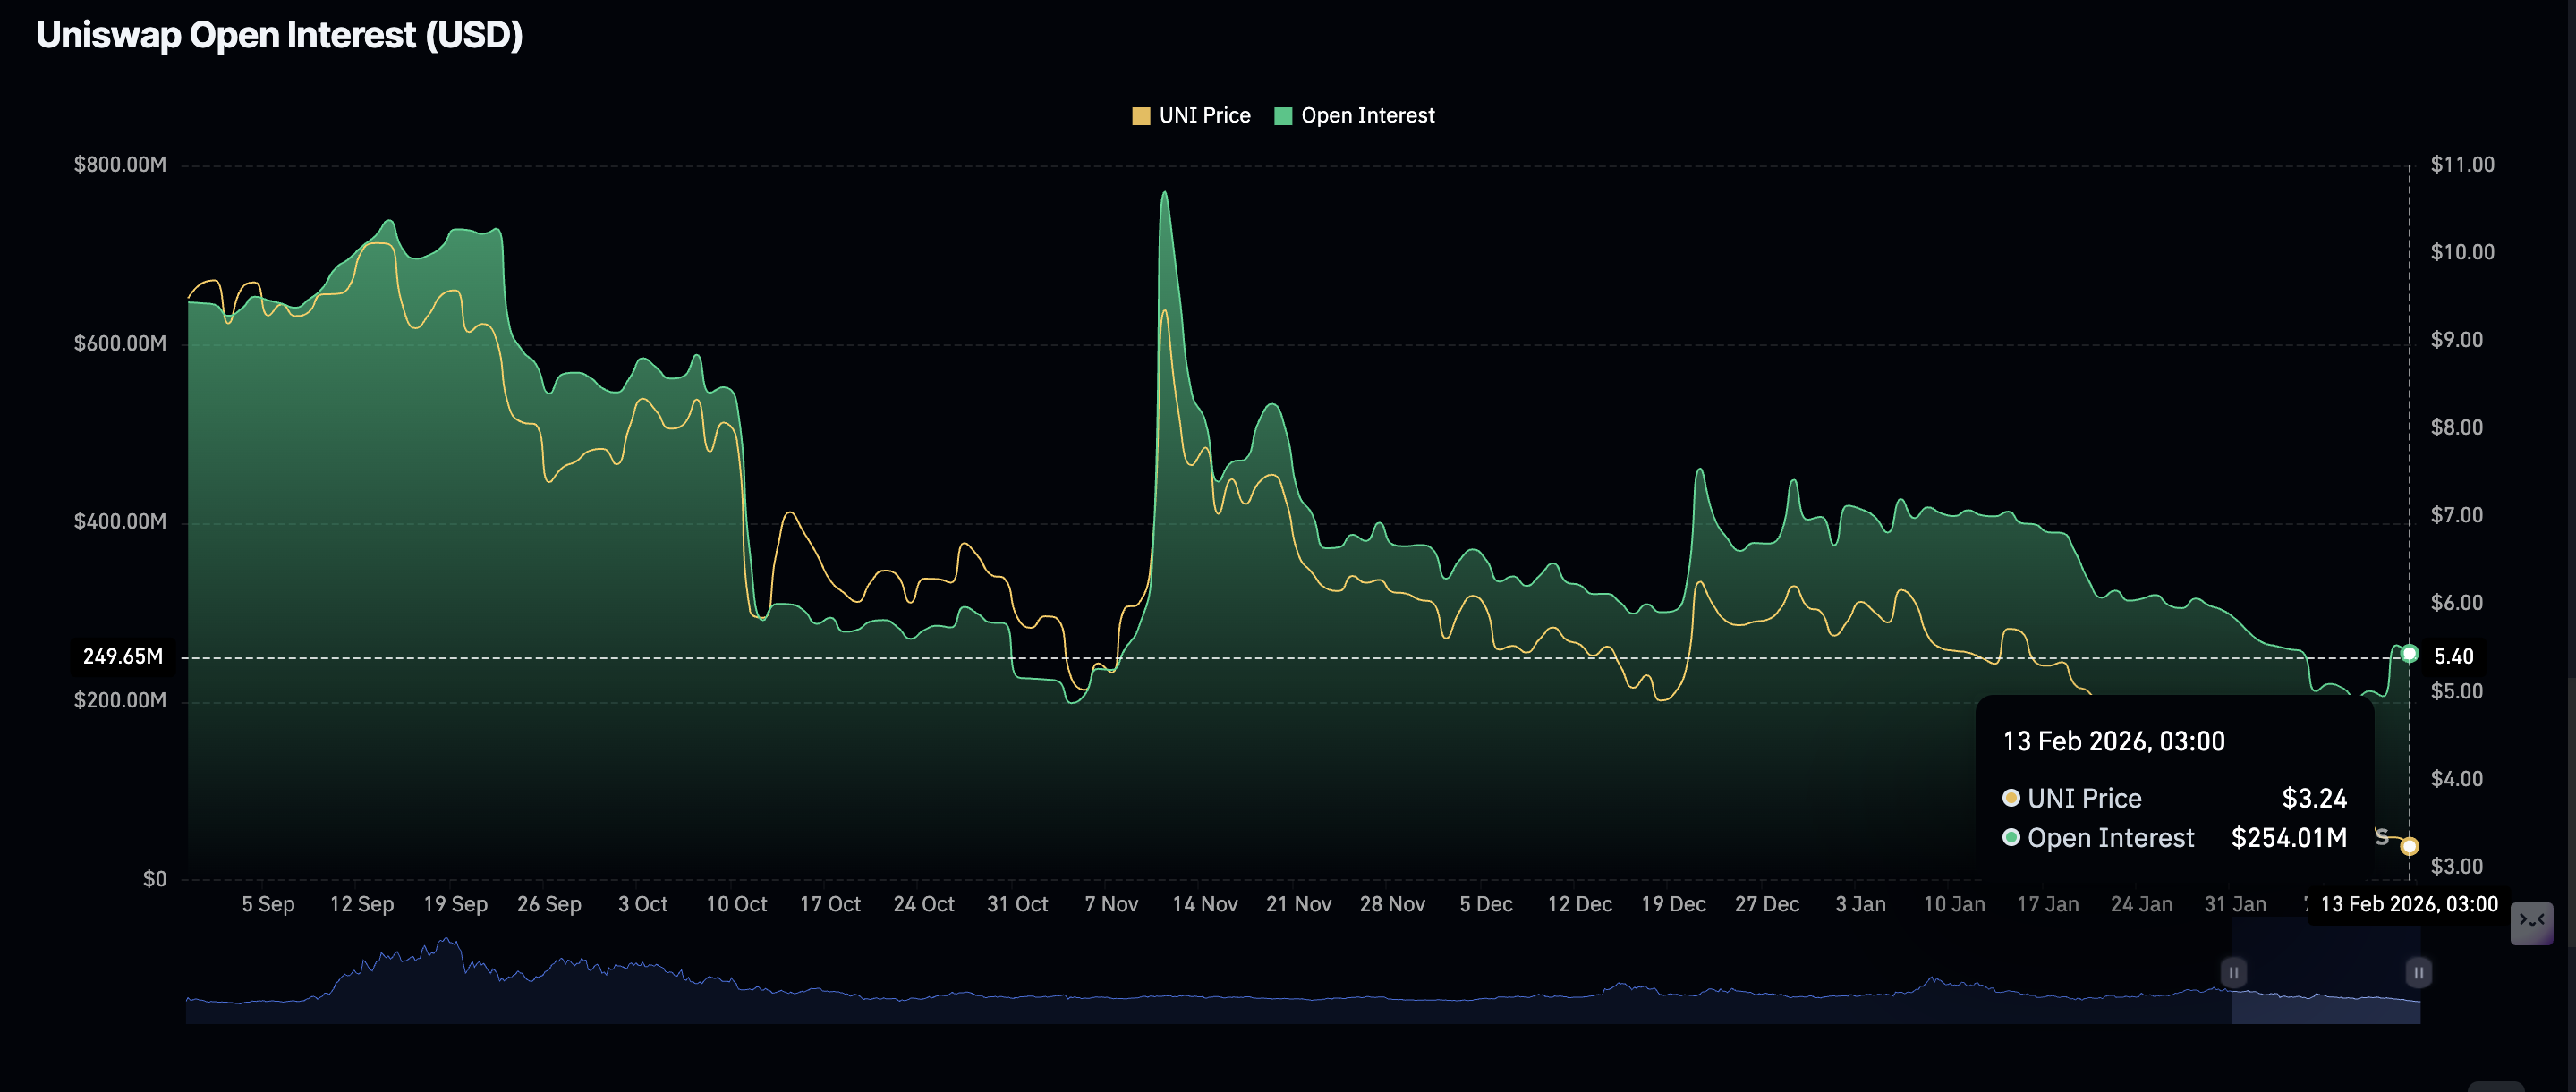
- UNI futures Open Interest cools to $254 million on Friday after briefly rising to $263 million on Tuesday.
- The MACD and the RSI momentum indicators support Uniswap’s short-term bullish outlook.
Uniswap (UNI) rises alongside other cryptocurrencies, trading at $3.44 at the time of writing on Friday. The native decentralized exchange (DEX) token’s 7% intraday increase mirrors improving sentiment following the Bureau of Labor Statistics (BLS) release of the January Consumer Price Index (CPI) report.
According to the report, January CPI rose 0.2% MoM, beating expectations of 0.3%, and 2.4% YoY, while the market expected 2.5%.
The Core CPI, which excludes the volatile prices of food and energy, increased 2.5% YoY, matching expectations. Easing inflation lifts the outlook for risk assets such as crypto. Investors generally expect the Federal Reserve (Fed) to cut interest rates at least twice in 2026.
Uniswap gains momentum amid low retail interest
Interest in Uniswap surged this week, supported by BlackRock’s integration of its tokenized Treasury product BUILD fund on its DEX trading platform.
BlackRock Global Head of Digital Assets Robert Mitchnick stated that “The integration of BUIDL into UniswapX marks a major leap forward in the interoperability of tokenized USD yield funds with stablecoins.”
BlackRock also purchased an undisclosed amount of UNI tokens, boosting market sentiment. As a result, derivatives activity surged, with futures Open Interest (OI) reaching $263 million on Tuesday before cooling to $253 million on Friday. The decline in OI suggests that investors are not yet convinced that UNI can sustain an uptrend in the short term.
Technical outlook: Evaluating UNI’s short-term outlook
The Uniswap uptrend on Friday places it above a crucial short-term support level at $3.40, with bulls expected to defend the area to maintain control. Meanwhile, the Relative Strength Index (RSI) indicates that bearish momentum is easing, rising to 32 from oversold territory.
A decisive increase in the RSI toward the midline at 50 would reinforce the bullish grip and increase the odds of UNI extending recovery above $4.00.
The Moving Average Convergence Divergence (MACD) indicator is poised for a bullish crossover above the signal line, prompting traders to increase their risk exposure. A steady recovery would be anticipated if the green histogram bars continue to expand above the zero line.
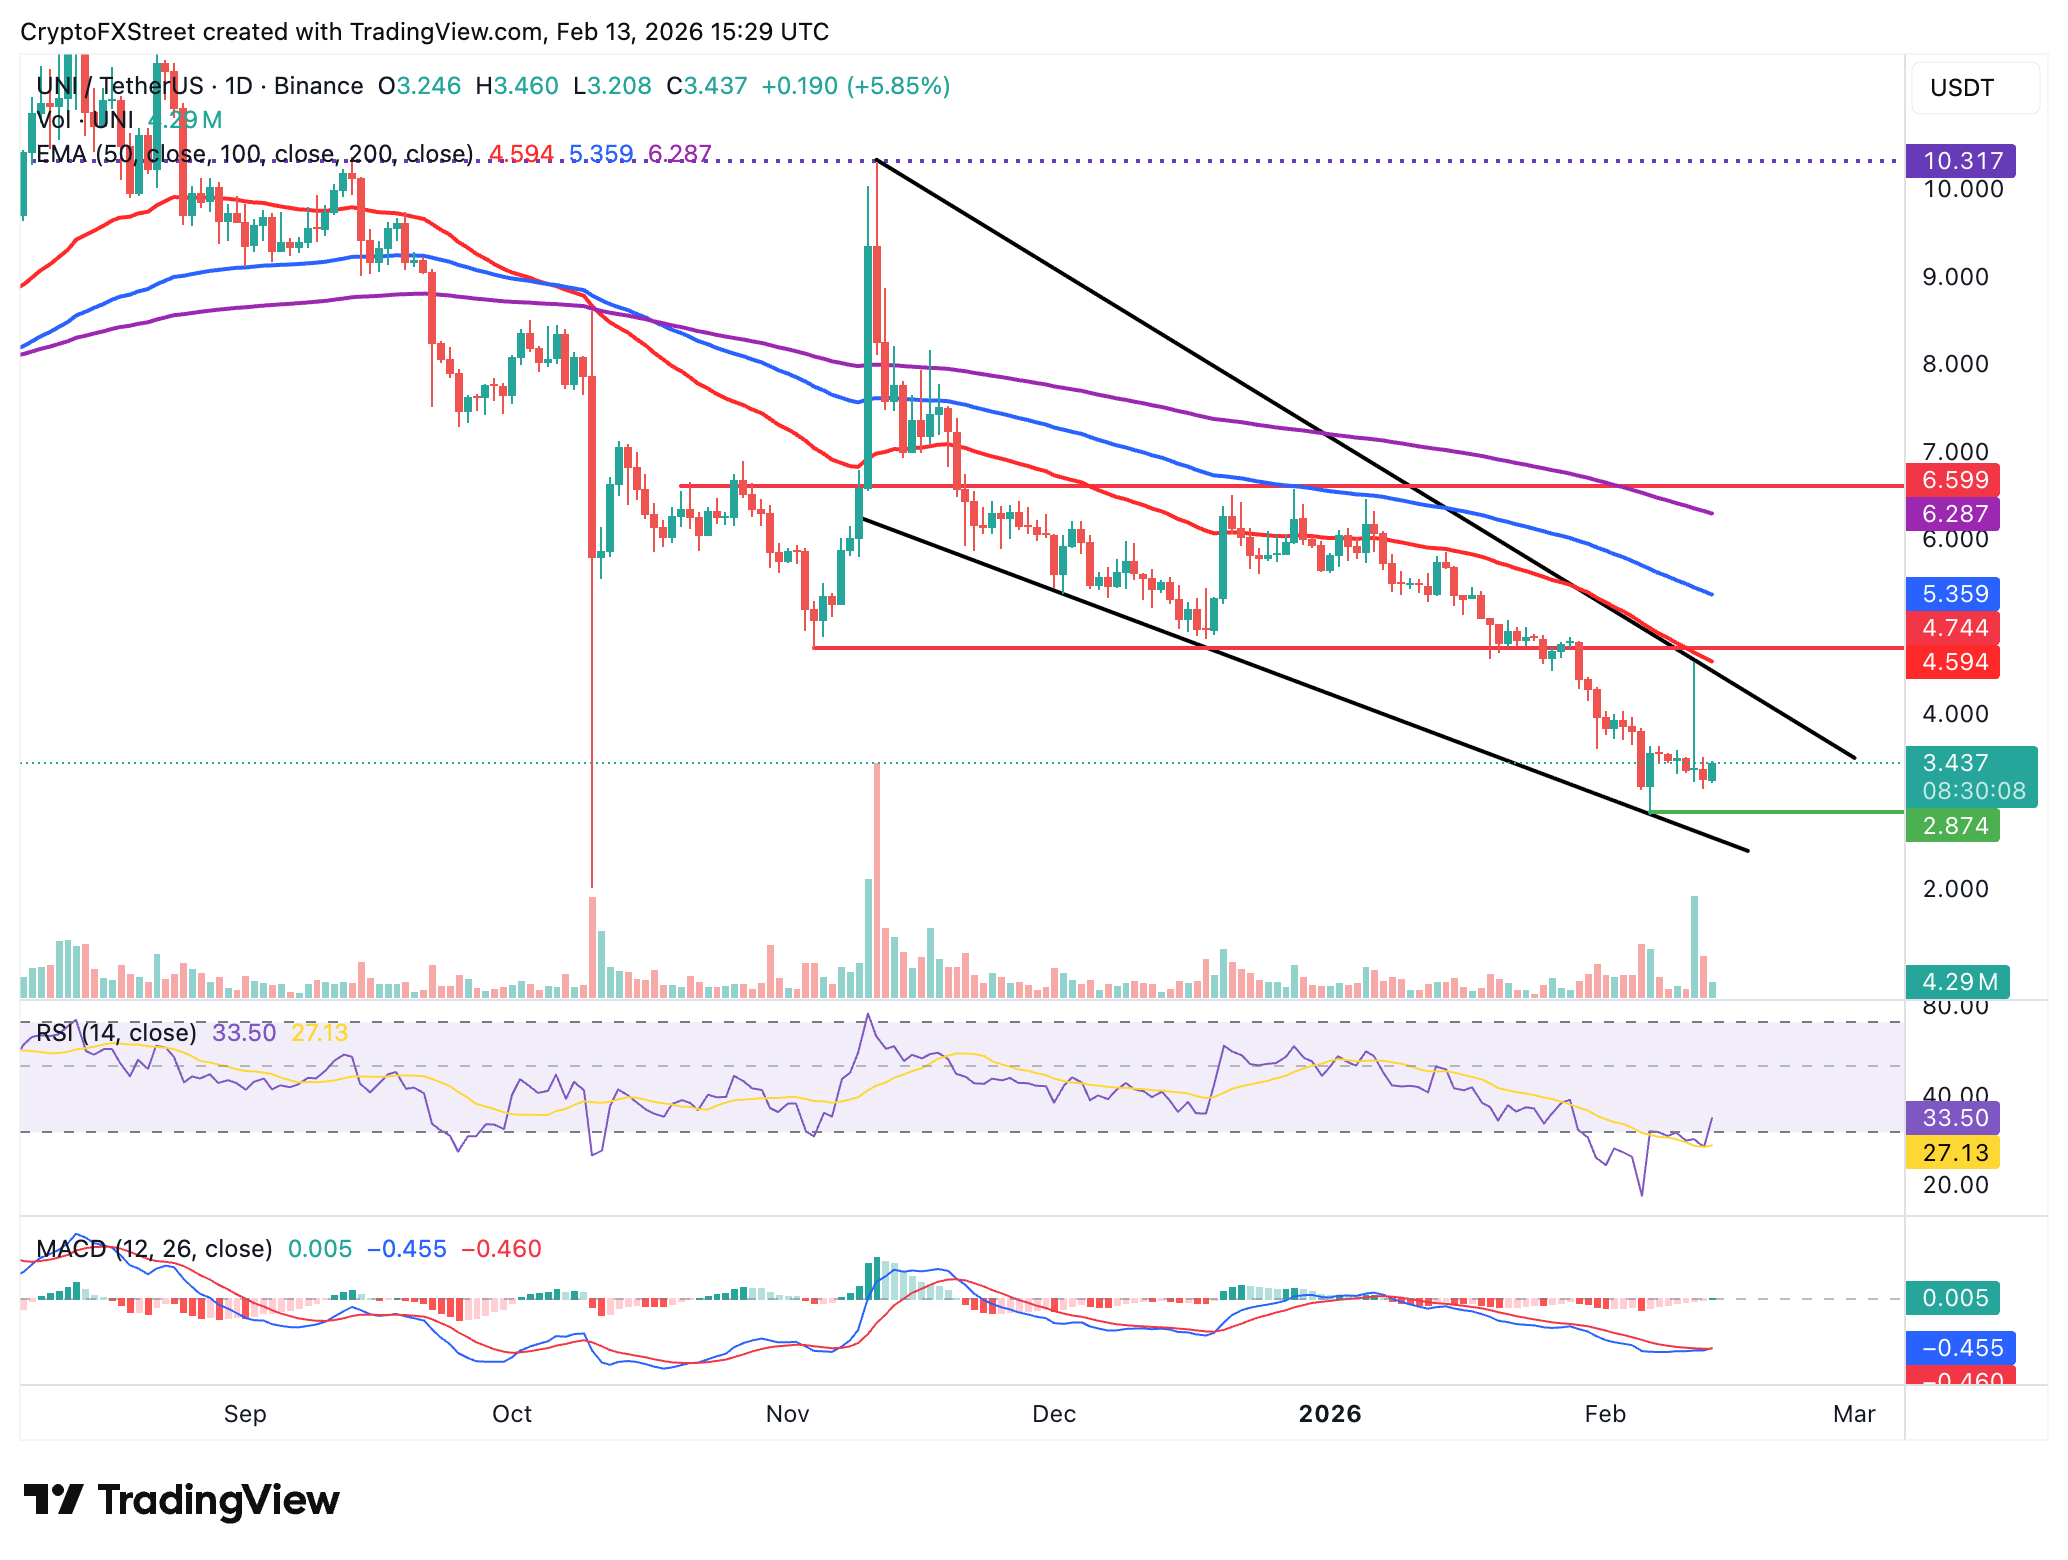
Conversely, the three applied moving averages, including the 50-day Exponential Moving Average (EMA) at $4.60, the 100-day EMA at $5.36, and the 200-day EMA at $6.28, are sloping downward, which could hinder a sustained recovery.
Open Interest, funding rate FAQs
Higher Open Interest is associated with higher liquidity and new capital inflow to the market. This is considered the equivalent of increase in efficiency and the ongoing trend continues. When Open Interest decreases, it is considered a sign of liquidation in the market, investors are leaving and the overall demand for an asset is on a decline, fueling a bearish sentiment among investors.
Funding fees bridge the difference between spot prices and prices of futures contracts of an asset by increasing liquidation risks faced by traders. A consistently high and positive funding rate implies there is a bullish sentiment among market participants and there is an expectation of a price hike. A consistently negative funding rate for an asset implies a bearish sentiment, indicating that traders expect the cryptocurrency’s price to fall and a bearish trend reversal is likely to occur.
Recommended Articles


