
Ripple Price Forecast: XRP recovery optimism in jeopardy as retail demand lags
- XRP rises for the second consecutive day despite the general crypto market outlook remaining bearish.
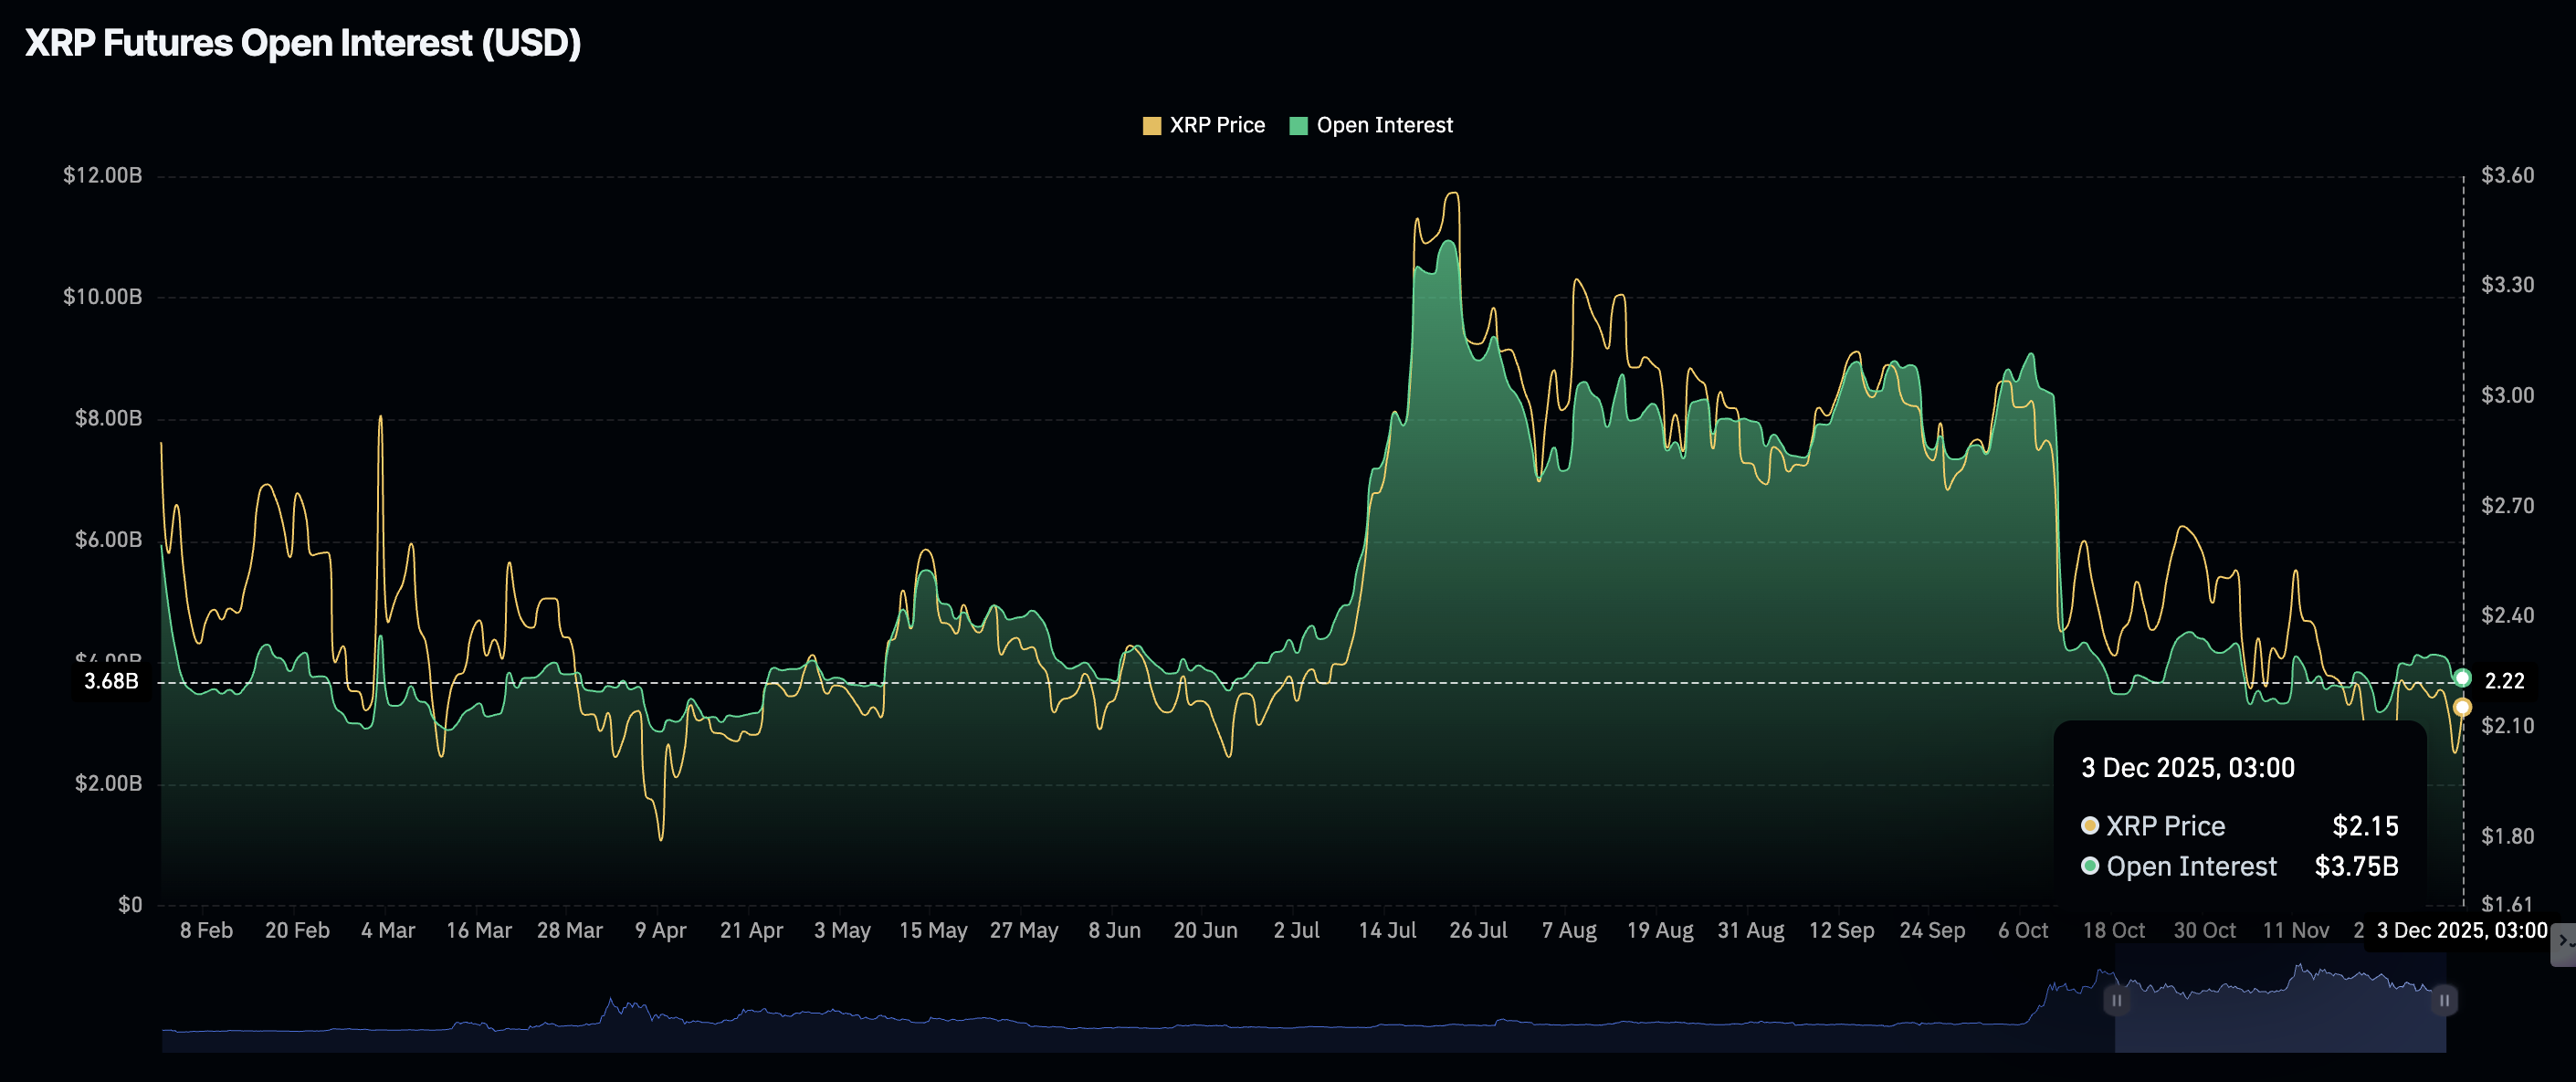
- Retail demand for XRP derivatives declines, with futures Open Interest averaging $3.75 billion on Wednesday.
- XRP spot ETFs mark 12 days of consecutive inflows, with the total volume averaging $824 million.
Ripple (XRP) is trading at around $2.17 at the time of writing, as bulls push to regain control of the trend. Despite the broader cryptocurrency market's bearish outlook, XRP has risen for the second consecutive day, signaling a potential bullish shift.
Low retail demand continues to cap XRP's upside
XRP bulls are aiming to gain momentum alongside other crypto majors such as Bitcoin (BTC) and Ethereum (ETH). However, retail interest in the cross-border remittance token has been significantly suppressed since the October 10 flash crash.
The XRP futures Open Interest (OI) averages $3.75 billion on Wednesday, down 55% from $8.36 billion on October 10. This decline underscores a weak derivatives market, as investors continue to lose confidence in the token's ability to sustain an uptrend.
OI tracks the notional value of outstanding futures contracts; hence, a steady increase is required to support price increases.
As for XRP spot Exchange Traded Funds (ETFs), institutional interest has not faltered since their debut in the United States (US) on November 13. SoSoValue data shows that XRP ETFs recorded nearly $68 million in inflow volume on Tuesday, building on a robust bullish streak.
Meanwhile, cumulative total net inflow volume stands at $824 million, with net assets averaging $845 million as of Tuesday. Continued ETF inflows will likely support positive market sentiment and increase the odds of a sustained uptrend.

Technical outlook: XRP recovery stalls under key moving averages
XRP is trading at $2.17 at the time of writing on Wednesday. The cross-border remittance token remains below the falling 50-day Exponential Moving Average (EMA) at $2.32, 100-day EMA at $2.47 and the 200-day EMA at $2.50, which will likely cap rebounds.
The Moving Average Convergence Divergence (MACD) indicator on the daily chart shows the blue line above the signal line and near the zero mark. The green histogram bars are edging higher, hinting at mild bullish momentum.
At the same time, the RSI sits at 47 (neutral), reflecting balanced flows and a subdued bid. With the SuperTrend parked at $2.40 and the Parabolic SAR rising to $1.86, topside remains challenged while dips find trailing support.
Parabolic SAR below price at 1.8646 supports a gradual basing attempt, but the overhead SuperTrend at $2.40 and the 200-day EMA at 2.50 cap recovery ambitions.

A decisive close above the 50-day EMA at $2.32 would tilt momentum in favor of bulls and expose the $2.40–$2.47 resistance corridor, while stalling under the moving averages would extend consolidation. Further widening in the positive MACD histogram would strengthen the near-term bias; if it flattens, range-bound conditions would persist.
The RSI needs a break above 50 to validate traction; failure would leave the market vulnerable to renewed tests of the SAR trail at $1.86.
Cryptocurrency metrics FAQs
The developer or creator of each cryptocurrency decides on the total number of tokens that can be minted or issued. Only a certain number of these assets can be minted by mining, staking or other mechanisms. This is defined by the algorithm of the underlying blockchain technology. On the other hand, circulating supply can also be decreased via actions such as burning tokens, or mistakenly sending assets to addresses of other incompatible blockchains.
Market capitalization is the result of multiplying the circulating supply of a certain asset by the asset’s current market value.
Trading volume refers to the total number of tokens for a specific asset that has been transacted or exchanged between buyers and sellers within set trading hours, for example, 24 hours. It is used to gauge market sentiment, this metric combines all volumes on centralized exchanges and decentralized exchanges. Increasing trading volume often denotes the demand for a certain asset as more people are buying and selling the cryptocurrency.
Funding rates are a concept designed to encourage traders to take positions and ensure perpetual contract prices match spot markets. It defines a mechanism by exchanges to ensure that future prices and index prices periodic payments regularly converge. When the funding rate is positive, the price of the perpetual contract is higher than the mark price. This means traders who are bullish and have opened long positions pay traders who are in short positions. On the other hand, a negative funding rate means perpetual prices are below the mark price, and hence traders with short positions pay traders who have opened long positions.
(The technical analysis of this story was written with the help of an AI tool)
Recommended Articles


