Bitcoin Mayer Multiple Retraces To Lower Bound—What Comes Next?

Source Newsbtc

Data shows the Bitcoin Mayer Multiple has declined to the lower bound of its range recently, which suggests a slowdown in momentum for BTC.

Bitcoin Mayer Multiple Is Now Retesting Its Lower Bound

As explained by on-chain analytics firm Glassnode in a new post on X, the Bitcoin Mayer Multiple has retraced to the lower bound of its long-term range. The “Mayer Multiple” refers to an indicator that keeps track of the ratio between the BTC spot price and its 200-day moving average (MA).

In technical analysis (TA), the 200-day MA is considered as a boundary between macro bullish and bearish trends. Whenever BTC is trading above this line, a bullish bias may be assumed to be in play. Similarly, the asset being under the mark can imply a market downturn.

Since the Mayer Multiple compares the spot price with this level, it essentially tells us about how far above or below Bitcoin is from the bull-bear boundary. The cryptocurrency gaining a large distance over the 200-day MA may imply it’s becoming overpriced, while it being too far under could increase the chances of a rebound to the upside taking place.

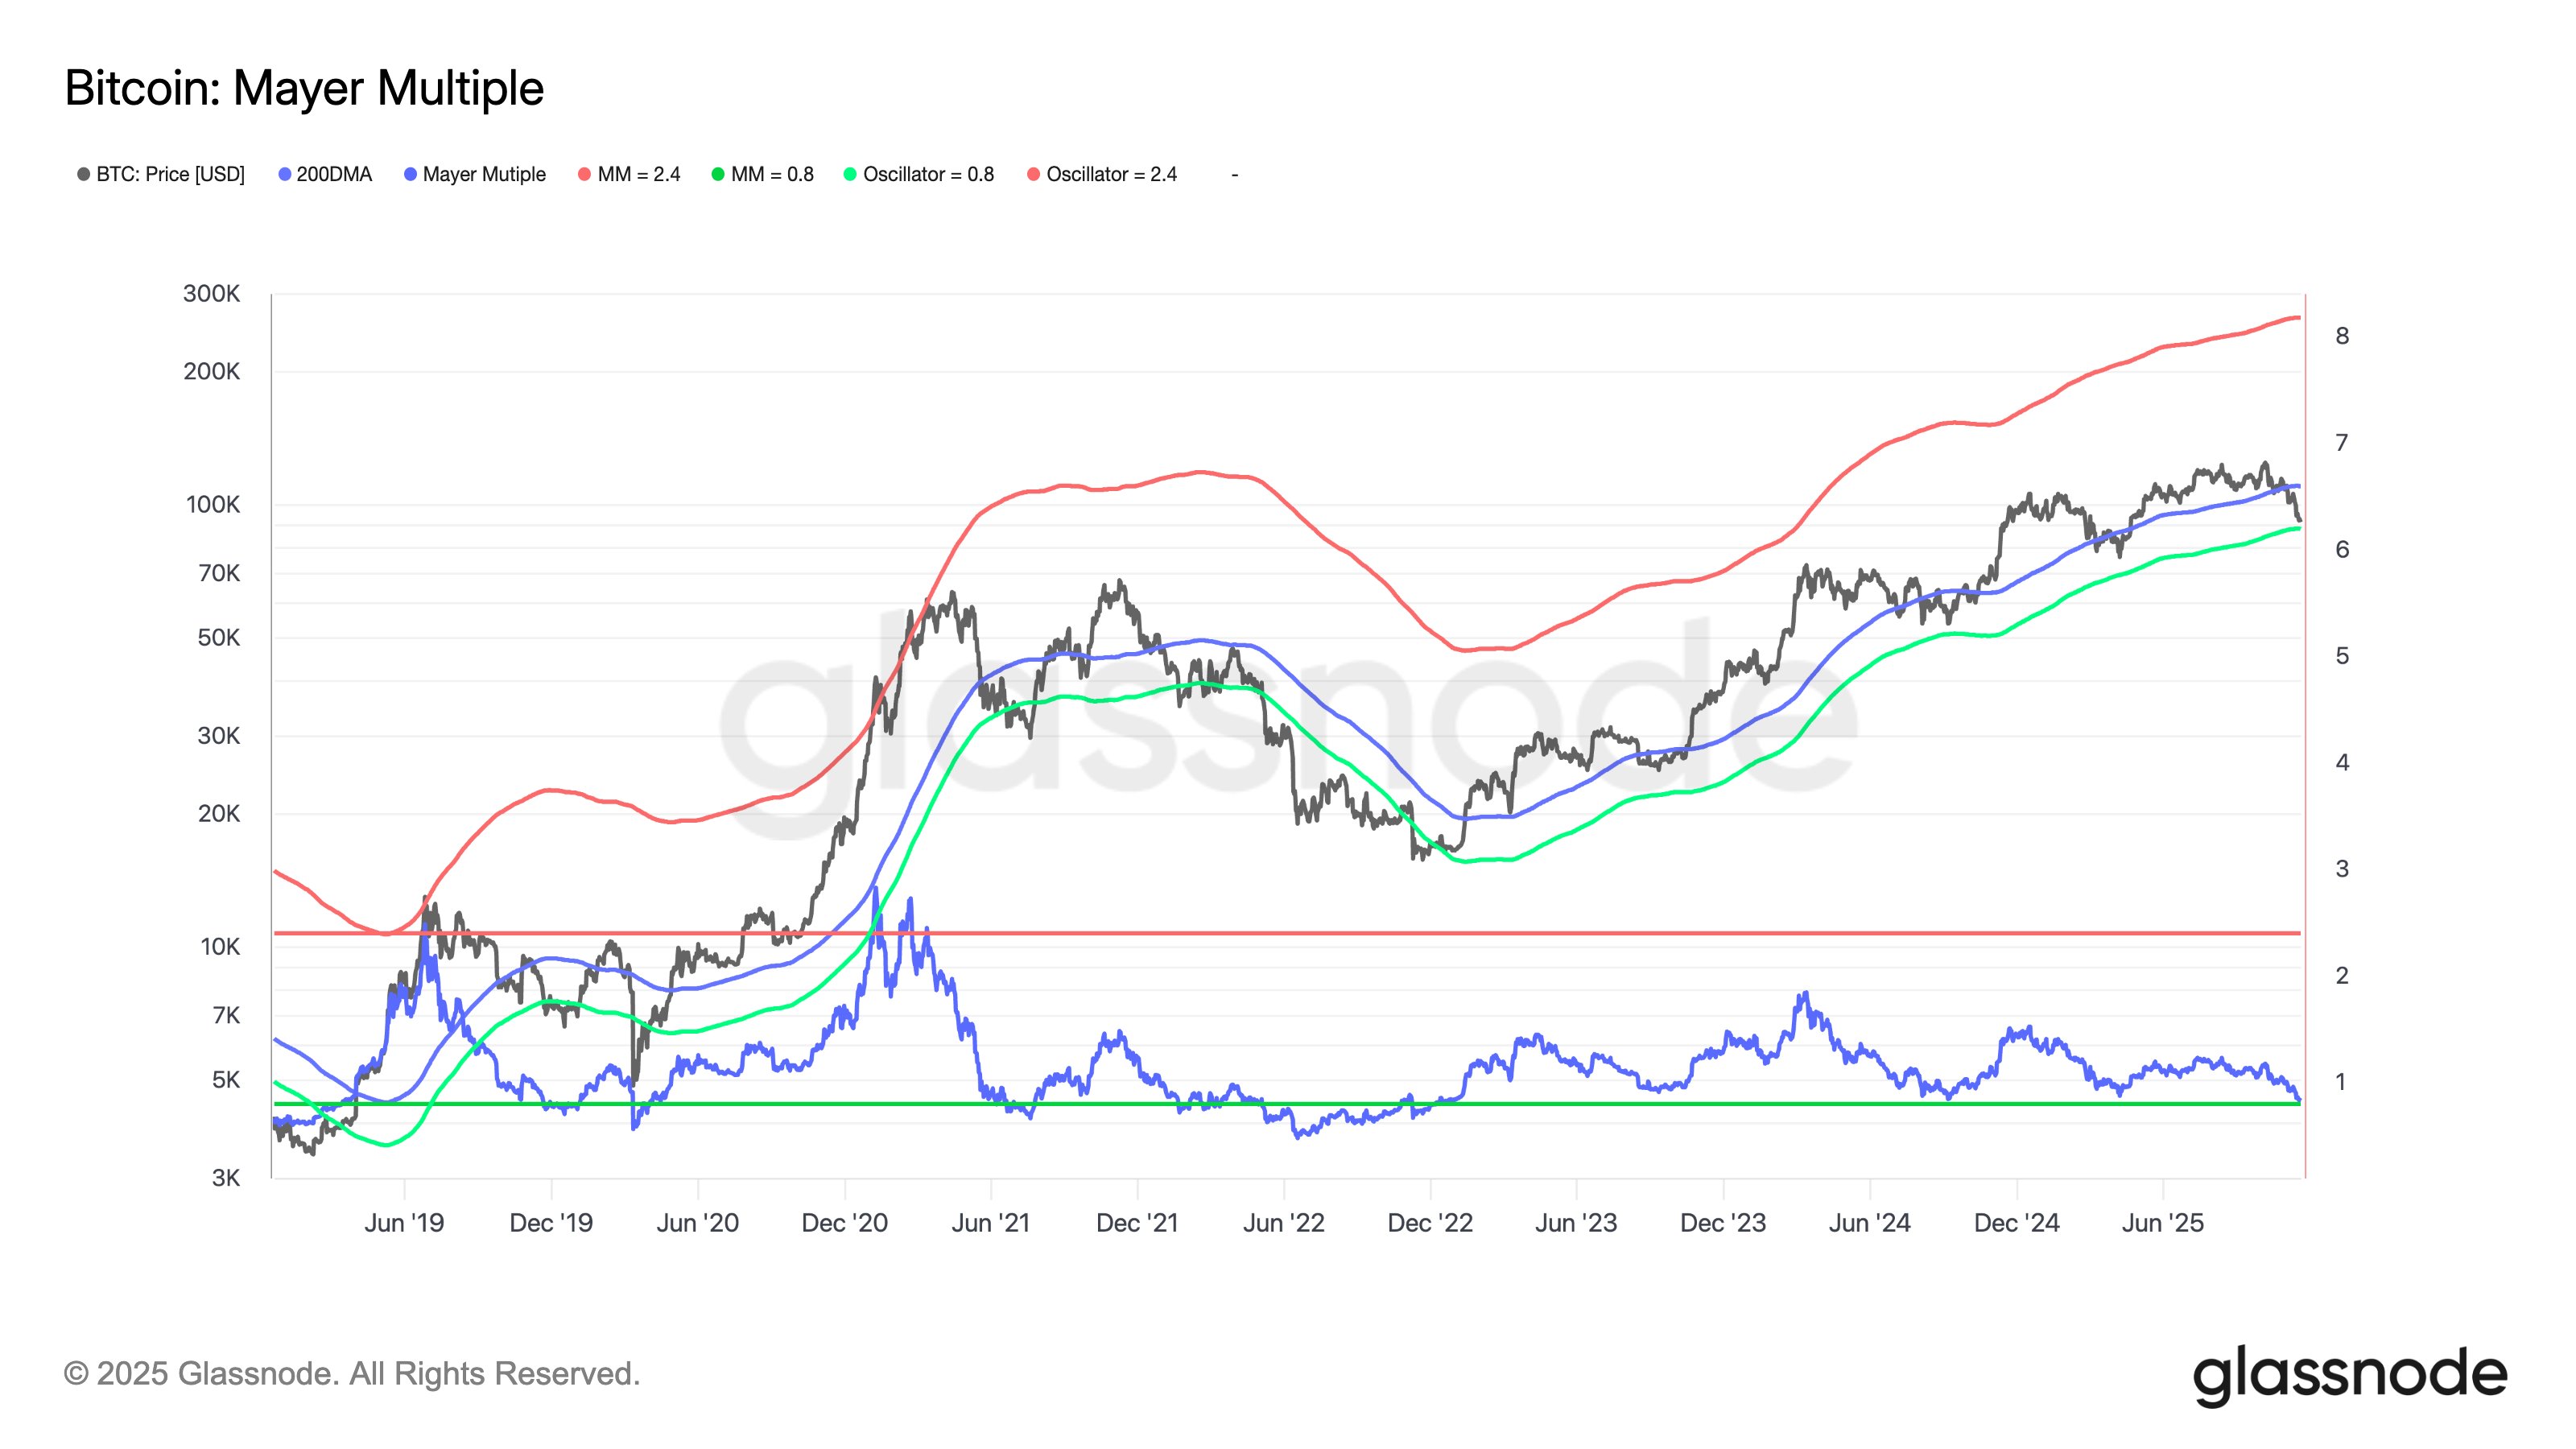
Now, here is the chart shared by Glassnode that shows how the Bitcoin Mayer Multiple is looking right now:
Bitcoin Mayer Multiple

As displayed in the above graph, the Bitcoin spot price has broken below the 200-day MA with its recent downtrend, which has resulted in the Mayer Multiple approaching a value of 0.8.

This 0.8 level happens to be where the indicator’s long-term range has found its lower boundary in the past. The last time the metric fell below this line was during the 2022 bear market.

“Historically, such compressions have aligned with value-driven phases where price consolidates and demand begins to step in,” noted the analytics firm. It now remains to be seen whether a break below is coming for Bitcoin or not.

This technical boundary isn’t the only one that BTC is retesting; there are also a couple of important on-chain levels that the cryptocurrency happens to be trading around right now, making the current range a potentially significant one.

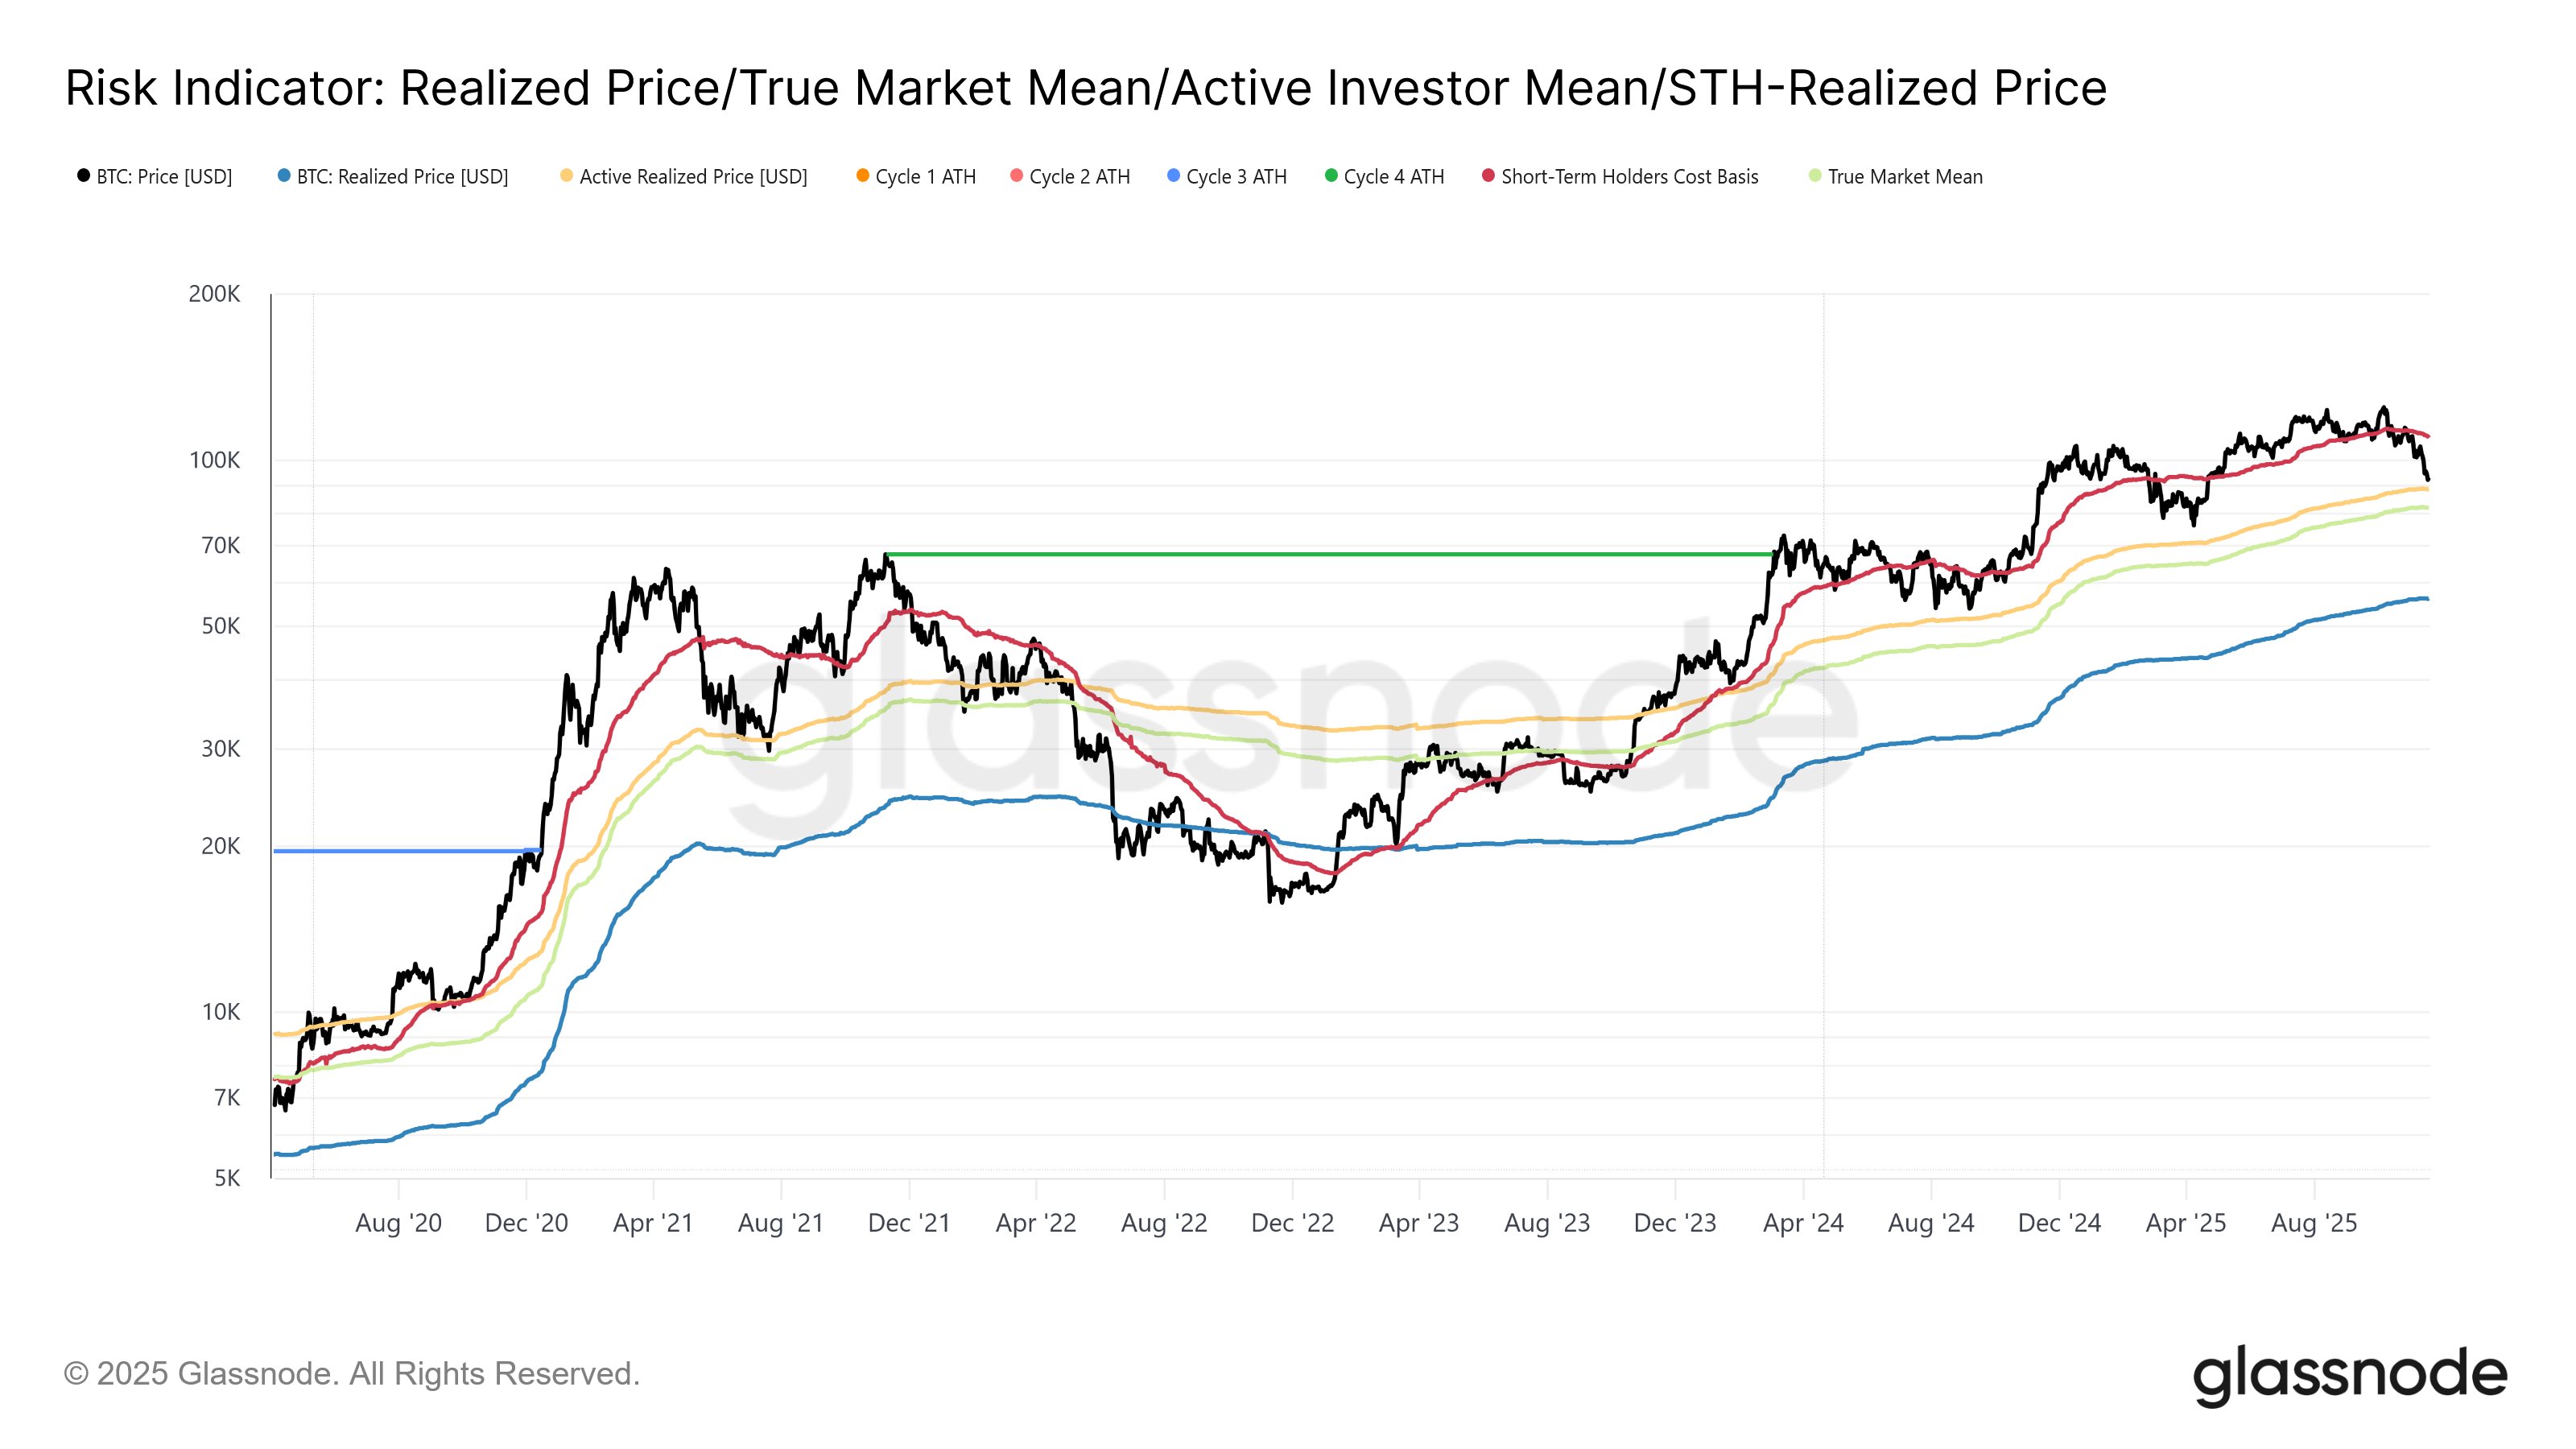
In a post on X, Glassnode senior researcher CryptoVizArt.₿ has shared some of the major on-chain price models.
Bitcoin On-Chain Levels

With its drop in the past day, Bitcoin has slipped under the Active Realized Price situated at $88,600, corresponding to the average cost basis of the active market participants.

The next closest level is the True Market Mean, which is another cost basis model for the BTC network. Currently, this level is located at $82,000. “A breakdown below both Active Investors and the True Market Mean would mark the first major confirmation of a deeper bear trend since May 2022,” explained the Glassnode researcher.

BTC Price

At the time of writing, Bitcoin is trading around $87,200, down 13% over the last week.

Bitcoin Price Chart
Disclaimer: For information purposes only. Past performance is not indicative of future results.
placeholder
Top 3 Price Prediction: Bitcoin, Ethereum, Ripple – BTC, ETH and XRP Look for a Foothold After a Sharp ShakeoutBitcoin trades near $92,600 after a dip below $90,000, while Ethereum around $3,118 and XRP near $2.21–$2.23 sit on key support zones, as BTC, ETH and XRP all try to turn a sharp correction into a tradable rebound rather than a deeper slide.
Author  Mitrade
Nov 19, Wed
Bitcoin trades near $92,600 after a dip below $90,000, while Ethereum around $3,118 and XRP near $2.21–$2.23 sit on key support zones, as BTC, ETH and XRP all try to turn a sharp correction into a tradable rebound rather than a deeper slide.
placeholder
Even As Bitcoin's Price Falls, Michael Saylor Feels 'Indestructible'The price of Bitcoin dipped below $89,000, setting a new weekly low as corporate buyer Strategy remains bullish.
Author  Mitrade
Yesterday 03: 08
The price of Bitcoin dipped below $89,000, setting a new weekly low as corporate buyer Strategy remains bullish.
placeholder
Could XRP Really Catch Ethereum? Analysts Revisit the Question as ETF Tailwinds BuildAs US spot XRP ETFs roll out and issuers like Canary Capital and Franklin Templeton step in, analysts say XRP’s market cap could climb on growing utility and ETF accumulation—but overtaking Ethereum’s $373 billion smart-contract powerhouse remains a long-shot, at least for now.
Author  Mitrade
Yesterday 03: 28
As US spot XRP ETFs roll out and issuers like Canary Capital and Franklin Templeton step in, analysts say XRP’s market cap could climb on growing utility and ETF accumulation—but overtaking Ethereum’s $373 billion smart-contract powerhouse remains a long-shot, at least for now.
placeholder
Bitcoin's Drop to $86K Approaches 'Max Pain' Zone, Yet Presents Potential Buying OpportunityAnalysts identify the $84,000 to $73,000 range as Bitcoin's likely "max pain" territory where capitulation may occur.
Author  Mitrade
7 hours ago
Analysts identify the $84,000 to $73,000 range as Bitcoin's likely "max pain" territory where capitulation may occur.
placeholder
Market Meltdown: BTC, ETH, and XRP Capitulate as Bears Seize ControlBitcoin trades around $85,900 after breaking below $86,000, with Ethereum under $2,791 and XRP below $1.99 as BTC, ETH and XRP extend weekly losses of 8–10%, forcing traders to focus on supports at $85,000, $2,749 and $1.77 for clues on whether this sell-off has further to run.
Author  Mitrade
6 hours ago
Bitcoin trades around $85,900 after breaking below $86,000, with Ethereum under $2,791 and XRP below $1.99 as BTC, ETH and XRP extend weekly losses of 8–10%, forcing traders to focus on supports at $85,000, $2,749 and $1.77 for clues on whether this sell-off has further to run.
goTop
quote