

Crude Oil Price Forecast: Oil Falls 4% as US, Iran Signal Talks, Technicals Point to Brent Testing $88

Source Tradingkey

TradingKey - On Monday, November 9, Eastern Time, international oil prices fell again. As of press time, Brent crude futures (UKOIL) fell 4.3% to $93.7 per barrel; U.S. WTI crude futures (USOIL) fell 3.5% to $87.76 per barrel. Intraday, Brent crude's decline briefly exceeded 5%.

Signals of negotiations between the U.S. and Iran, coupled with unconfirmed reports of Iranian concessions regarding the Strait of Hormuz, eased market concerns over escalating conflict and energy supply disruptions, driving down the geopolitical risk premium in oil prices.

According to media reports including Iran's Tasnim News Agency and Qatar's Al Jazeera, Iranian President Masoud Pezeshkian stated on the 9th that the Supreme Leader had ordered an end to the 'neither war nor peace' state. Iran is willing to resolve issues through negotiations on the premise of safeguarding its dignity, but will not bow to coercion or bullying.

Trump said over the weekend that the likelihood of the U.S. launching a large-scale military strike against Iran was 'extremely low.' However, in a subsequent interview, he emphasized that this depends on whether Iran is willing to sign a 'very tough deal,' showing that the risk of military action remains tied to the outcome of negotiations.

Short-term diplomatic signals can depress the risk premium, but whether shipping security can achieve sustained improvement still depends on the terms and enforcement of negotiations. Moving forward, the key focus for the market is whether concession rumors can be officially confirmed and whether diplomatic engagements can translate into a substantive agreement.
3-30a2b9c603154494b8b49277a6bdbcc9

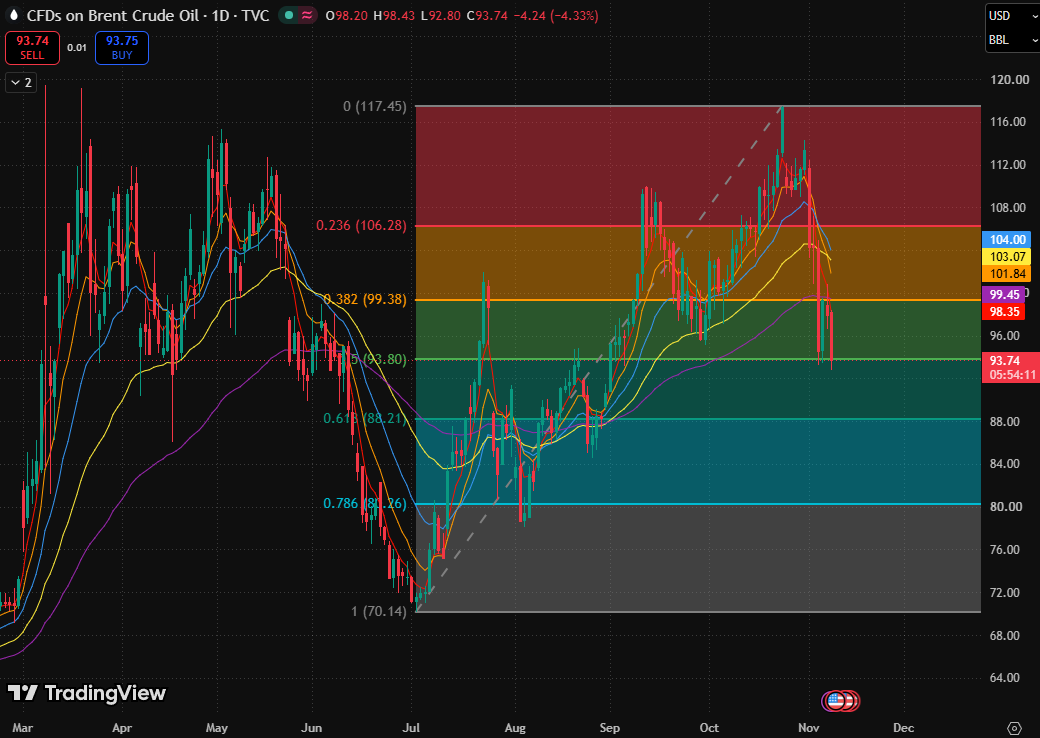
Brent crude daily price chart, Source: TradingView

From a technical perspective, Brent crude's short-term upward momentum has been disrupted, and it currently needs to be confirmed first whether the pullback can stabilize near the halfway mark. Regarding moving averages, although the price is below all five moving averages, the three medium-term moving averages still retain their original bullish sequence; thus, it cannot yet be characterized as a complete bearish alignment across all five moving averages.

Going forward, only if the daily close reclaims $93.80 per barrel and holds it during a subsequent retest will the pullback meet the preliminary conditions for stabilization. Immediate resistance above lies in the $98.35–$99.45 per barrel area formed by the 5-day exponential moving average, the 0.382 Fibonacci retracement level, and the 160-day exponential moving average; the more significant resistance zone is between $101.84 and $104.00 per barrel, where the 10-day, 80-day, and 20-day exponential moving averages reside.

If the price pulls back further and breaks below the intraday low ($92.80 per barrel), and fails to reclaim it on a rebound, buying support will weaken and the risk of a further pullback will rise, potentially dropping toward the 0.618 Fibonacci retracement level ($88.21 per barrel) to seek support.

Disclaimer: For information purposes only. Past performance is not indicative of future results.
placeholder
US October CPI Preview: Inflation Growth May Slow, How Will US Stocks, Dollar and Gold React? On Tuesday (Nov. 10) Eastern Time, the U.S. will release the October Consumer Price Index (CPI), a key inflation reading ahead of the Federal Reserve's December interest rate decision. Th
Author  TradingKey
10 hours ago
On Tuesday (Nov. 10) Eastern Time, the U.S. will release the October Consumer Price Index (CPI), a key inflation reading ahead of the Federal Reserve's December interest rate decision. Th
placeholder
Bitcoin Price Forecast: BTC faces pressure as weekly ETF outflows hit $1.28 billionBitcoin (BTC) remains under pressure on Monday, trading below the 50-week Simple Moving Average (SMA) at $75,222 after extending its losing streak to five consecutive weeks.
Author  FXStreet
10 hours ago
Bitcoin (BTC) remains under pressure on Monday, trading below the 50-week Simple Moving Average (SMA) at $75,222 after extending its losing streak to five consecutive weeks.
placeholder
Weekly Report: The AI capex consensus was wrong last week — the scorecard points to one crowding riskThree consensus calls went into last week. Two were wrong: the Philadelphia Semiconductor Index fell 12.15% and Micron dropped 17.46% after beating estimates, while the Dow lost only 0.94%. The scorecard says the mistake was not about AI demand but about how crowded the trade had become — and CoreWeave, Cisco and Applied Materials will grade it again this week.
Author  Irene Q.
12 hours ago
Three consensus calls went into last week. Two were wrong: the Philadelphia Semiconductor Index fell 12.15% and Micron dropped 17.46% after beating estimates, while the Dow lost only 0.94%. The scorecard says the mistake was not about AI demand but about how crowded the trade had become — and CoreWeave, Cisco and Applied Materials will grade it again this week.
placeholder
Weekly Report: The dollar rose and the euro rose with it — three FX divergences, one should convergeDXY added 0.41% last week and EURUSD added 0.41% in the same five sessions, despite a 60-day correlation of -0.73. AUDUSD fell 1.36% after the RBA's sixth hike of the year, and USDJPY barely moved 0.19% even as markets priced a December BOJ hike. Three divergences, one of which the mechanism forces to close.
Author  Irene Q.
13 hours ago
DXY added 0.41% last week and EURUSD added 0.41% in the same five sessions, despite a 60-day correlation of -0.73. AUDUSD fell 1.36% after the RBA's sixth hike of the year, and USDJPY barely moved 0.19% even as markets priced a December BOJ hike. Three divergences, one of which the mechanism forces to close.
placeholder
The CPI that has no year-over-year number is the one that decides DecemberOctober CPI lands on Nov 10 at 13:30 GMT, and it will be published without a year-over-year figure: BLS never collected October 2025 prices during the federal shutdown. Consensus is +0.3% headline and +0.2% core month-on-month, against +0.6% and +0.3% in September. With December hike odds at 77%, the month-on-month print is now the whole story, and $4,197–4,202 on gold and 4.86% on the 10-year are the levels that price it.
Author  Irene Q.
15 hours ago
October CPI lands on Nov 10 at 13:30 GMT, and it will be published without a year-over-year figure: BLS never collected October 2025 prices during the federal shutdown. Consensus is +0.3% headline and +0.2% core month-on-month, against +0.6% and +0.3% in September. With December hike odds at 77%, the month-on-month print is now the whole story, and $4,197–4,202 on gold and 4.86% on the 10-year are the levels that price it.
goTop
quote