


Gold bears retain control as markets brace for Fed rate hike
- Gold remains under pressure as rising US Treasury yields, a stronger US Dollar and Fed rate-hike bets weigh on the metal.
- Traders avoid large directional bets ahead of Wednesday’s Fed decision and updated economic projections.
- XAU/USD remains technically vulnerable while trading below the 100-day and 200-day SMAs.
Gold (XAU/USD) remains on the defensive on Tuesday as a stronger US Dollar (USD), rising US Treasury yields and US Federal Reserve (Fed) interest rate hike expectations create a challenging backdrop for the non-yielding metal. However, the decline lacks strong follow-through as traders avoid placing large bets ahead of the Fed’s monetary policy decision on Wednesday.
At the time of writing, XAU/USD trades near $4,280, hovering above the more-than-one-month low of $4,253 touched on Monday.
US Treasury yields extend their rise across the curve on Tuesday, with the benchmark 10-year yield testing the 5% threshold at its highest level since 2007. Higher yields support demand for the US Dollar while increasing the opportunity cost of holding Gold, which offers no interest.
The US Dollar Index (DXY), which tracks the Greenback's value against a basket of six major currencies, trades around 99.60 near two-week highs.
The bond sell-off is not limited to the United States, with borrowing costs across several major economies climbing to multi-year highs. Much of the move stems from the energy shock caused by the war in the Middle East, which is adding to inflation concerns and reinforcing expectations of tighter monetary policy.
Since the outbreak of the war, Gold has reacted more strongly to shifts in interest rate expectations than to geopolitical developments. The Fed has kept interest rates unchanged so far, but high Oil prices are adding to inflation and making it harder to bring it back to the central bank's 2% target.
Headline Consumer Price Index (CPI) inflation stood at 3.4% YoY in August, while the Producer Price Index (PPI) accelerated to 5.4% from 4.8% in July. Recent Fed communication has also centred on the need to bring inflation back to target. As a result, markets widely expect the central bank to deliver its first interest rate hike since 2023 when it concludes its two-day monetary policy meeting on Wednesday.
Much of the hawkish Fed risk appears to be priced in. However, Gold could remain vulnerable if policymakers signal that September marks the beginning of a broader tightening cycle. Such a message could extend the rise in Treasury yields and provide additional support to the US Dollar. Attention will therefore centre on the updated economic projections and Fed Chairman Kevin Warsh’s comments on the path of interest rates.
Strategists at BNY Mellon expect the Fed to deliver a hike at this week’s FOMC meeting and “probably one more this year,” but caution that “the path to even higher policy rates is strewn with potential impediments to significantly tighter policy.” While “the market sees a total of nearly four rate hikes (approx. 100bp) through the end of next year,” BNY Mellon argues that “by then the economy won’t be able to handle rates that high for very long, and the Fed will be contemplating dialing back its restrictiveness toward the second half of the year.”
Technical analysis: Gold faces further downside risks below key SMAs, building bearish momentum
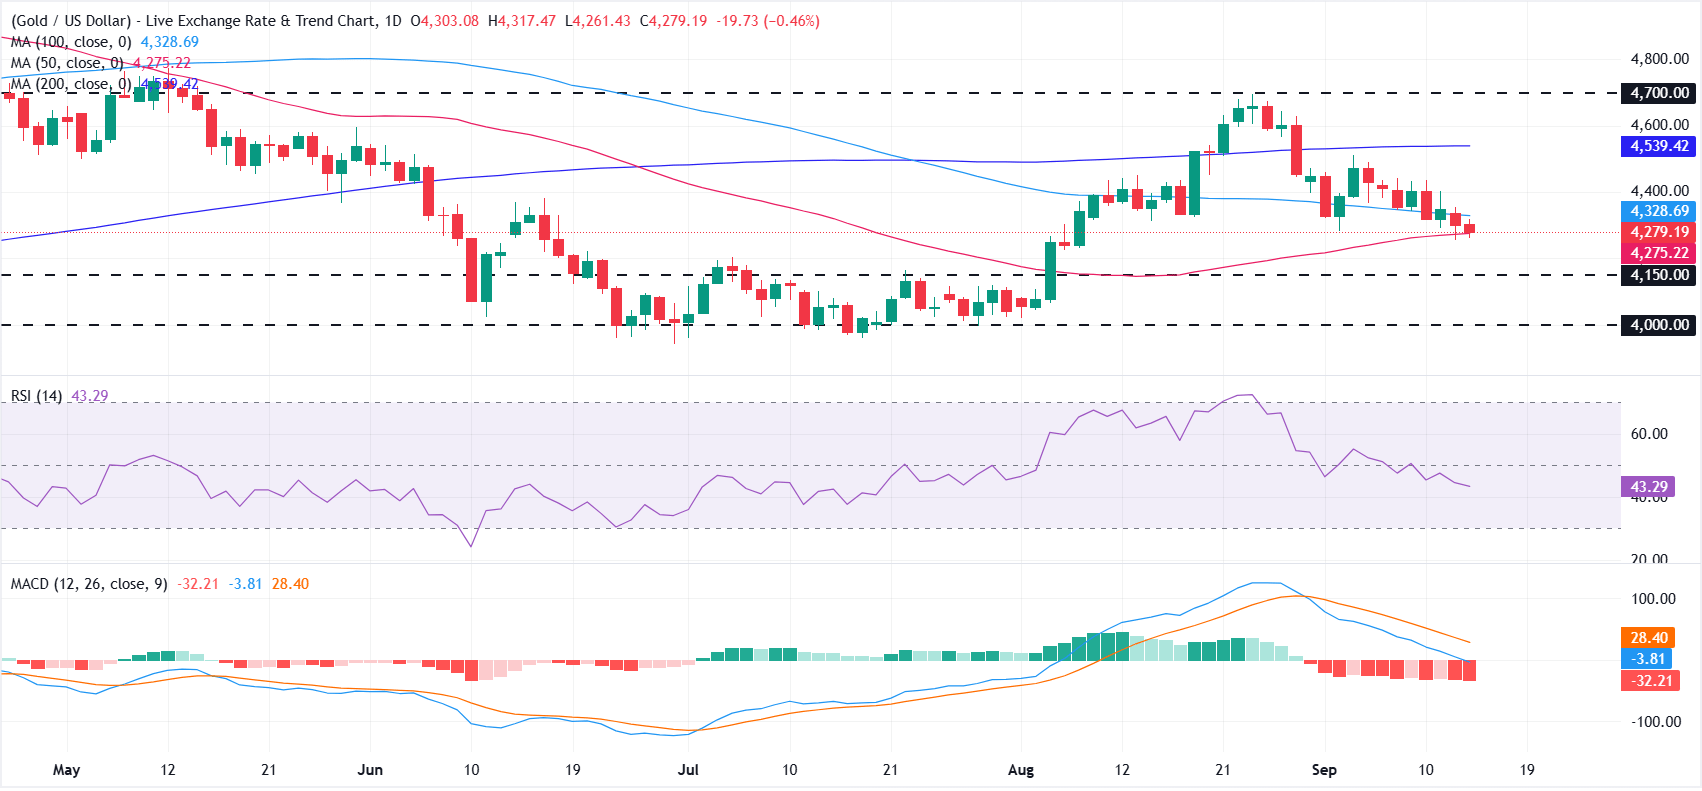
On the daily chart, XAU/USD maintains a bearish near-term bias as price holds below the 100-day Simple Moving Average (SMA) and the 200-day SMA. The metal is marginally above the 50-day SMA at about $4,275, which offers tentative support, but a soft Relative Strength Index (RSI) around 43 and a negative, declining Moving Average Convergence Divergence (MACD) histogram suggest increasing bearish momentum and leave the broader recovery vulnerable to further downside.
On the topside, initial resistance is aligned with the 100-day SMA at $4,328, ahead of a more substantial cap at the 200-day SMA near $4,539 and the horizontal barrier around $4,700. On the downside, a break below the 50-day SMA at $4,275 would expose the next horizontal floors at $4,150 and $4,000, where buyers are likely to reassess the medium-term trend.
(The technical analysis of this story was written with the help of an AI tool. Know more.)
Fed FAQs
Monetary policy in the US is shaped by the Federal Reserve (Fed). The Fed has two mandates: to achieve price stability and foster full employment. Its primary tool to achieve these goals is by adjusting interest rates. When prices are rising too quickly and inflation is above the Fed’s 2% target, it raises interest rates, increasing borrowing costs throughout the economy. This results in a stronger US Dollar (USD) as it makes the US a more attractive place for international investors to park their money. When inflation falls below 2% or the Unemployment Rate is too high, the Fed may lower interest rates to encourage borrowing, which weighs on the Greenback.
The Federal Reserve (Fed) holds eight policy meetings a year, where the Federal Open Market Committee (FOMC) assesses economic conditions and makes monetary policy decisions. The FOMC is attended by twelve Fed officials – the seven members of the Board of Governors, the president of the Federal Reserve Bank of New York, and four of the remaining eleven regional Reserve Bank presidents, who serve one-year terms on a rotating basis.
In extreme situations, the Federal Reserve may resort to a policy named Quantitative Easing (QE). QE is the process by which the Fed substantially increases the flow of credit in a stuck financial system. It is a non-standard policy measure used during crises or when inflation is extremely low. It was the Fed’s weapon of choice during the Great Financial Crisis in 2008. It involves the Fed printing more Dollars and using them to buy high grade bonds from financial institutions. QE usually weakens the US Dollar.
Quantitative tightening (QT) is the reverse process of QE, whereby the Federal Reserve stops buying bonds from financial institutions and does not reinvest the principal from the bonds it holds maturing, to purchase new bonds. It is usually positive for the value of the US Dollar.
Recommended Articles


