


USD/CHF Price Forecast: Daily chart favours bulls despite mixed momentum signals
- USD/CHF rebounds as US Dollar strength keeps the Swiss Franc under pressure.
- The technical outlook remains bullish above the 50-, 100- and 200-day SMAs.
- The RSI signals positive momentum, while a slightly negative MACD suggests some loss of upside strength.
USD/CHF starts the week on a positive note, snapping a two-day losing streak as broad US Dollar (USD) strength and a wide interest rate differential between the Federal Reserve (Fed) and the Swiss National Bank (SNB) keep the Swiss Franc (CHF) under persistent selling pressure. At the time of writing, the pair trades around 0.8333, hovering near levels last seen in May 2025.
The US Dollar Index (DXY), which tracks the Greenback against six major currencies, trades around 102.45, holding close to last week’s peak of 102.53, its highest level since April 2025.
Traders now look ahead to September’s US Consumer Price Index (CPI) report on Wednesday, followed by the Producer Price Index (PPI) on Thursday. With no major Swiss economic releases scheduled this week, USD/CHF is likely to remain largely driven by US Dollar dynamics and shifting expectations surrounding the Fed’s interest rate outlook.
Technical analysis
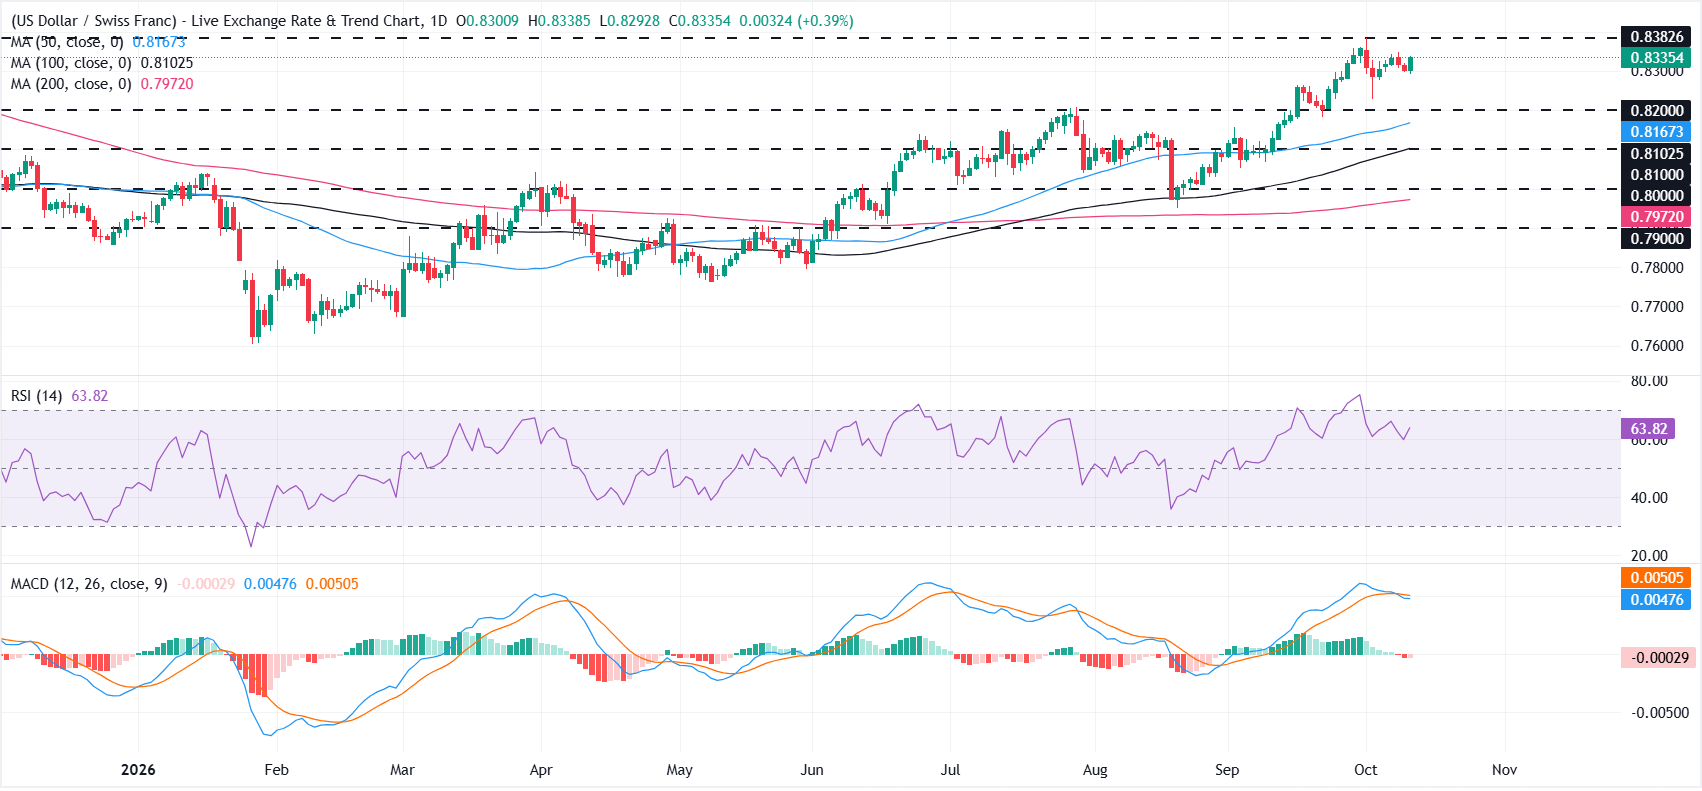
On the daily chart, USD/CHF holds a constructive bullish bias as it remains comfortably above the 50-, 100- and 200-day Simple Moving Averages (SMAs) clustered between roughly 0.8167 and 0.7972. The Relative Strength Index (RSI) around 63 suggests positive but not extreme upside momentum, while the Moving Average Convergence Divergence (MACD) has slipped slightly into negative territory, hinting at a mild loss of short-term momentum rather than a clear bearish reversal.
On the topside, immediate resistance is located at the October 1 high of 0.8383, where a break higher would reopen the path for further gains. On the downside, initial support is seen at 0.8200, followed by the 50-day SMA at 0.8167. Further down, the 100-day SMA at 0.8102 is closely aligned with the 0.8100 psychological mark, followed by the 0.8000 level. The 200-day SMA at 0.7972 comes into focus on a deeper pullback, ahead of the 0.7900 support level.
(The technical analysis of this story was written with the help of an AI tool. Know more.)
Swiss Franc Price This Year
The table below shows the percentage change of Swiss Franc (CHF) against listed major currencies this year. Swiss Franc was the strongest against the Euro.
| USD | EUR | GBP | JPY | CAD | AUD | NZD | CHF | |
|---|---|---|---|---|---|---|---|---|
| USD | 5.17% | 1.93% | 1.40% | 4.13% | -4.19% | 3.51% | 5.20% | |
| EUR | -5.17% | -3.13% | -3.53% | -0.90% | -8.57% | -1.51% | 0.11% | |
| GBP | -1.93% | 3.13% | -0.42% | 2.29% | -5.61% | 1.70% | 3.34% | |
| JPY | -1.40% | 3.53% | 0.42% | 2.62% | -5.41% | 1.61% | 3.88% | |
| CAD | -4.13% | 0.90% | -2.29% | -2.62% | -7.82% | -0.99% | 1.03% | |
| AUD | 4.19% | 8.57% | 5.61% | 5.41% | 7.82% | 7.71% | 9.48% | |
| NZD | -3.51% | 1.51% | -1.70% | -1.61% | 0.99% | -7.71% | 1.64% | |
| CHF | -5.20% | -0.11% | -3.34% | -3.88% | -1.03% | -9.48% | -1.64% |
The heat map shows percentage changes of major currencies against each other. The base currency is picked from the left column, while the quote currency is picked from the top row. For example, if you pick the Swiss Franc from the left column and move along the horizontal line to the US Dollar, the percentage change displayed in the box will represent CHF (base)/USD (quote).
Recommended Articles


