

EUR/USD Price Forecast: Bears crack 100-day SMA, eye 1.1500

Source Fxstreet
  • EUR/USD breaks 100-day SMA as sellers regain momentum.
  • Bearish RSI points lower while 50-day SMA guards downside.
  • Break below 1.1500 exposes 1.1450 and 1.1353 next.

The Euro extends its losses against the US Dollar, sliding below the 100-day Simple Moving Average (SMA) at 1.1555, opening the door to further downside, with sellers setting their sights on Monday’s low of 1.1523. The EUR/USD trades at 1.1548, slightly above the 50-day SMA of 1.1530.

EUR/USD Price Forecast: Technical Outlook

The pair seems poised to consolidate in the short-term, finding support at the 50-day SMA, but the rally was capped by the 100-day SMA. Momentum, as measured by the Relative Strength Index (RSI), is bearish and trending lower, indicating that sellers are strengthening.

If the EUR/USD dives below the 50-day SMA, it opens the door to challenge 1.1500. A breach of the latter will expose the 1.1450 psychological milestone and the July 28 swing low at 1.1353. On further weakness. The year-to-date (YTD) high is up next at 1.1324.

On the other hand, if EUR/USD is set for a recovery, buyers must reclaim the 100-day SMA at 1.1555. On further strength, the next area of interest is 1.1600, immediately followed by the 200-day SMA at 1.1632 and by 1.1650.

EUR/USD Price Chart – Daily
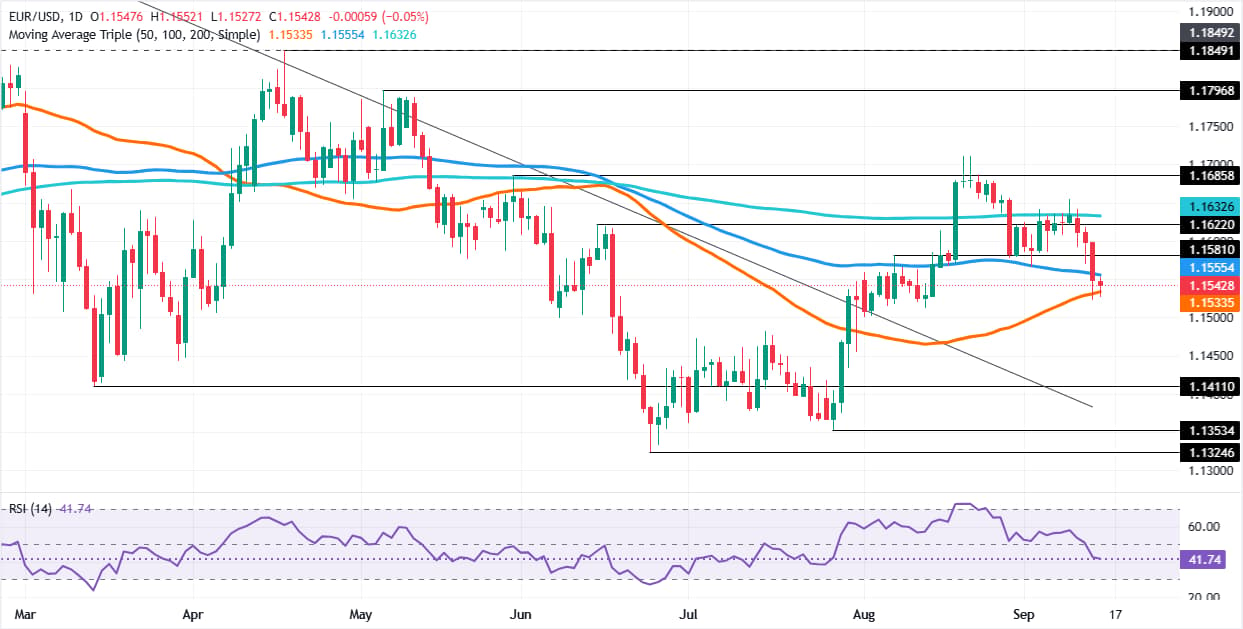
EUR/USD daily chart

Euro Price Today

The table below shows the percentage change of Euro (EUR) against listed major currencies today. Euro was the strongest against the Japanese Yen.

USD EUR GBP JPY CAD AUD NZD CHF
USD 0.05% 0.14% 0.50% 0.10% 0.12% 0.37% 0.15%
EUR -0.05% 0.09% 0.41% 0.05% 0.06% 0.31% 0.10%
GBP -0.14% -0.09% 0.33% -0.06% -0.03% 0.19% 0.00%
JPY -0.50% -0.41% -0.33% -0.38% -0.37% -0.13% -0.33%
CAD -0.10% -0.05% 0.06% 0.38% 0.01% 0.26% 0.05%
AUD -0.12% -0.06% 0.03% 0.37% -0.01% 0.24% 0.02%
NZD -0.37% -0.31% -0.19% 0.13% -0.26% -0.24% -0.20%
CHF -0.15% -0.10% -0.00% 0.33% -0.05% -0.02% 0.20%

The heat map shows percentage changes of major currencies against each other. The base currency is picked from the left column, while the quote currency is picked from the top row. For example, if you pick the Euro from the left column and move along the horizontal line to the US Dollar, the percentage change displayed in the box will represent EUR (base)/USD (quote).

Disclaimer: For information purposes only. Past performance is not indicative of future results.
placeholder
Crude Oil Price Forecast: Brent Nears $110 Amid Saudi Pipeline Outage, How Much Further Can Oil Rise?Supply risks in the Middle East continue to heat up, with international oil prices fluctuating at high levels.During Tuesday's Asian trading session, Brent crude futures (UKOIL-F) rose to
Author  TradingKey
11 hours ago
Supply risks in the Middle East continue to heat up, with international oil prices fluctuating at high levels.During Tuesday's Asian trading session, Brent crude futures (UKOIL-F) rose to
placeholder
【Daily Brief】10-year Treasury yield briefly tops 5%, S&P 500 slips to 7,602 and the dollar firms at 99.3 as the Fed's decision eve beginsThe 10-year Treasury yield touched 5.014% on Monday — its first print above 5% since October 2023 — while the S&P 500 closed 0.48% lower at 7,619.98 and the dollar index firmed to 99.3. Here is the full market wrap ahead of Wednesday's FOMC decision, the dot plot and the August retail sales report, plus today's CLARITY Act Senate vote.
Author  Irene Q.
11 hours ago
The 10-year Treasury yield touched 5.014% on Monday — its first print above 5% since October 2023 — while the S&P 500 closed 0.48% lower at 7,619.98 and the dollar index firmed to 99.3. Here is the full market wrap ahead of Wednesday's FOMC decision, the dot plot and the August retail sales report, plus today's CLARITY Act Senate vote.
placeholder
Gold falls below $4,300 as higher US yields bolster Fed rate hike betsGold price (XAU/USD) tumbles to near $4,295 during the early Asian session on Tuesday. The precious metal faces some selling pressure as rising bond yields and surging energy prices strengthen expectations that the US Federal Reserve (Fed) will raise interest rates this week. 
Author  FXStreet
18 hours ago
Gold price (XAU/USD) tumbles to near $4,295 during the early Asian session on Tuesday. The precious metal faces some selling pressure as rising bond yields and surging energy prices strengthen expectations that the US Federal Reserve (Fed) will raise interest rates this week. 
placeholder
Silver Price Forecast: XAG/USD falls to near $63.50 amid Fed hike bets, higher oil pricesSilver price (XAG/USD) loses its gains from the previous day, trading around $63.50 per troy ounce during Asian hours on Monday. Non-yielding Silver is currently facing significant headwinds driven by rising Federal Reserve (Fed) rate-hike expectations for the upcoming September decision.
Author  FXStreet
Yesterday 10: 37
Silver price (XAG/USD) loses its gains from the previous day, trading around $63.50 per troy ounce during Asian hours on Monday. Non-yielding Silver is currently facing significant headwinds driven by rising Federal Reserve (Fed) rate-hike expectations for the upcoming September decision.
placeholder
Fed hike odds near 90% into Wednesday's decision — how to trade the dollar, gold and the S&P 500A 0.3% monthly core CPI print has lifted the market-implied probability of a 25bp Fed hike on 16 September to roughly 86.5% ~ 90%, which would be the first increase since July 2023. Here is the decision timeline, the pricing versus the forecasts, both scenarios, and the key levels for the dollar, gold and the S&P 500.
Author  Suzie
Yesterday 07: 49
A 0.3% monthly core CPI print has lifted the market-implied probability of a 25bp Fed hike on 16 September to roughly 86.5% ~ 90%, which would be the first increase since July 2023. Here is the decision timeline, the pricing versus the forecasts, both scenarios, and the key levels for the dollar, gold and the S&P 500.
Related Instrument
goTop
quote