


Mexican Peso strengthens as Banxico hold extends 10-day rally
- USD/MXN extends ten-day slide after Banxico holds rates unchanged.
- Banxico sees inflation converging gradually, keeping policy restrictive longer.
- Fed hike bets persist as traders await Friday’s NFP report.
The Mexican peso extends its rally to 10 straight days, gaining over 0.12% on Thursday after the Bank of Mexico (Banxico) left interest rates unchanged. At the time of writing, the USD/MXN exotic pair trades at 17.21, after reaching a daily high of 17.26.
USD/MXN drops after Banxico holds rates at 6.50%
Banxico held rates at 6.50% for the second straight meeting, unanimously, after finishing its easing cycle on May 7. In the monetary policy statement, the central bank acknowledged that “Both headline and core inflation are still expected to decline throughout the forecast horizon, albeit more gradually than previously anticipated.”
The Mexican institution hinted that rates would remain at the current level for the foreseeable future, as the board expects both headline and core inflation to reach its 3% goat in Q4 2027, according to the bank’s projections. For 2026, they expect headline and core CPI to end at 3.5%.
Banxico mentioned that economic slack is anticipated to persist throughout the forecast period, and substantial downward risks to economic activity remain.
Aside from this, US jobs data was positive, as initial jobless claims for the week ending August 1 were 199K, above the previous week but below estimates of 202K. Meanwhile, the US Challenger Job Cuts revealed that planned layoffs dropped 27% to 33,429 in July, its lowest level in two years.
St. Louis Fed President Alberto Musalem was hawkish, reiterating that “inflation is well above the 2% target” and acknowledging that the balance of risks is that inflation will remain above target. Musalem added that “It is crucial that monetary policy put a meaningful restraint on underlying inflation, rather than tolerating somewhat higher inflation today to pursue productivity growth tomorrow.”
In the meantime, money markets continued to price in a 58% chance that the Fed will raise rates by 25 basis points at the September 16 meeting, according to Prime Terminal data.
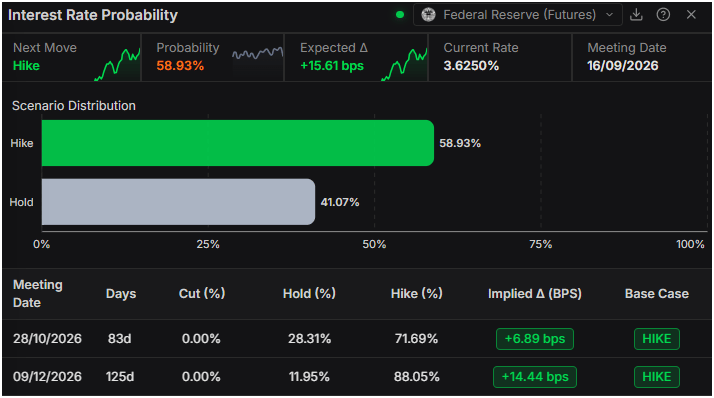
Ahed this week, the US schedule will feature July’s Nonfarm Payrolls, which are projected to improve from 57,000 to 80,000 and the Unemployment Rate to remain steady.
USD/MXN Price Forecast: Technical outlook
In the daily chart, USD/MXN trades at 17.2109, extending its decline below the clustered simple moving averages, with the latest triple SMA reading at 17.4104 acting as nearby overhead resistance. Price also remains under the more recent downward resistance trend line break at 17.4630, keeping the pair in a bearish near-term bias, while the Relative Strength Index (14) at 36.18 drifts toward oversold territory, hinting that selling pressure is still dominant but increasingly stretched.
On the topside, initial resistance aligns at the triple simple moving average cluster around 17.4104, followed by the downward resistance trend line break near 17.4630, where any recovery would likely stall unless buyers can secure a daily close above this zone. On the downside, the next notable structural floor emerges much lower at the prior major trend-line break around 15.7056, with the current setup suggesting rallies toward the 17.41–17.46 band may be viewed as opportunities for sellers while the price holds beneath these caps.
(The technical analysis of this story was written with the help of an AI tool. Know more.)
Mexican Peso FAQs
The Mexican Peso (MXN) is the most traded currency among its Latin American peers. Its value is broadly determined by the performance of the Mexican economy, the country’s central bank’s policy, the amount of foreign investment in the country and even the levels of remittances sent by Mexicans who live abroad, particularly in the United States. Geopolitical trends can also move MXN: for example, the process of nearshoring – or the decision by some firms to relocate manufacturing capacity and supply chains closer to their home countries – is also seen as a catalyst for the Mexican currency as the country is considered a key manufacturing hub in the American continent. Another catalyst for MXN is Oil prices as Mexico is a key exporter of the commodity.
The main objective of Mexico’s central bank, also known as Banxico, is to maintain inflation at low and stable levels (at or close to its target of 3%, the midpoint in a tolerance band of between 2% and 4%). To this end, the bank sets an appropriate level of interest rates. When inflation is too high, Banxico will attempt to tame it by raising interest rates, making it more expensive for households and businesses to borrow money, thus cooling demand and the overall economy. Higher interest rates are generally positive for the Mexican Peso (MXN) as they lead to higher yields, making the country a more attractive place for investors. On the contrary, lower interest rates tend to weaken MXN.
Macroeconomic data releases are key to assess the state of the economy and can have an impact on the Mexican Peso (MXN) valuation. A strong Mexican economy, based on high economic growth, low unemployment and high confidence is good for MXN. Not only does it attract more foreign investment but it may encourage the Bank of Mexico (Banxico) to increase interest rates, particularly if this strength comes together with elevated inflation. However, if economic data is weak, MXN is likely to depreciate.
As an emerging-market currency, the Mexican Peso (MXN) tends to strive during risk-on periods, or when investors perceive that broader market risks are low and thus are eager to engage with investments that carry a higher risk. Conversely, MXN tends to weaken at times of market turbulence or economic uncertainty as investors tend to sell higher-risk assets and flee to the more-stable safe havens.
Recommended Articles


