

Solana (SOLUSD) Is down 1.04% on Sep 16: Why It Happened

Source Tradingkey

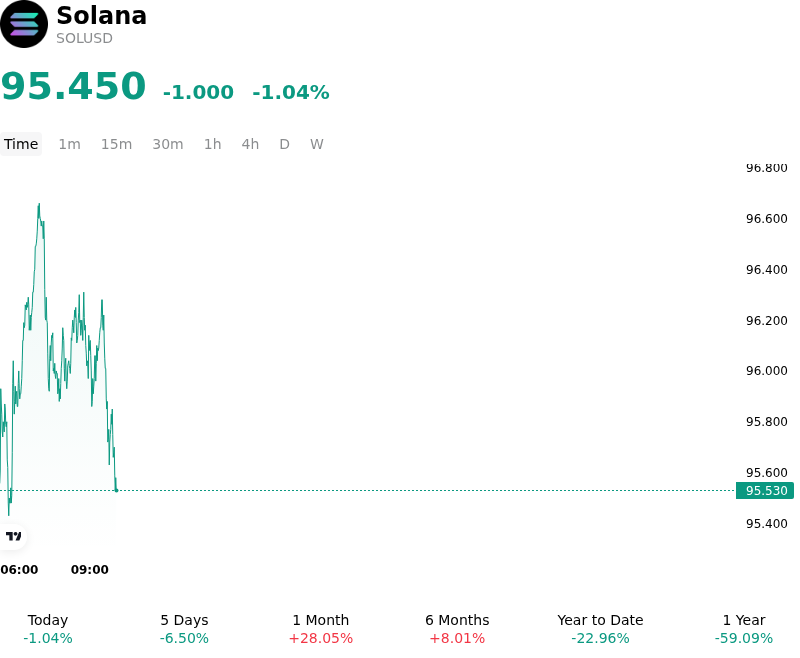
Solana (SOLUSD) is down 1.04% at Sep 16 21:55(ET), now at $95.45, with a 7-day down of 6.03%.
SummaryOverview

What is driving Solana (SOLUSD)’s stock price down today?

Macroeconomic liquidity pressures and heightened interest rate path uncertainty served as the primary drivers behind the tactical pullback in Solana. Ahead of the Federal Reserve policy decision, broader risk sentiment faced severe headwinds as surging U.S. Treasury yields and persistent inflation data forced a hawkish repricing across global financial markets. High-beta layer-one digital assets like Solana typically display elevated sensitivity to shifts in monetary policy expectations, prompting institutional and macro-focused investors to temporarily trim risk exposure and reduce portfolio leverage in favor of cash and yield-bearing fixed-income instruments.

Beyond the overarching macroeconomic drag, institutional capital flow dynamics contributed to the intraday weakness. Institutional demand experienced a notable pause as inflows into spot Solana exchange-traded products slowed sharply compared to earlier peak periods. The temporary deceleration in spot ETF momentum removed a vital passive buying mechanism that had previously absorbed market liquidity and sustained upward price momentum, leaving the order book more susceptible to routine sell-side distribution and profit-taking.

From a technical and market structure perspective, Solana ran into dense overhead resistance, triggering a consolidation phase. Derivatives positioning reflected long liquidation and position trimming as momentum indicators normalized from elevated levels. Despite this intraday retracement driven by tightening financial conditions and spot flow deceleration, underlying on-chain activity and ongoing protocol performance upgrades continue to provide a structural floor. Consequently, the current price action represents an event-driven macro repricing and liquidity management cycle rather than a fundamental deterioration in Solana ecosystem adoption.

Technical Analysis of Solana (SOLUSD)

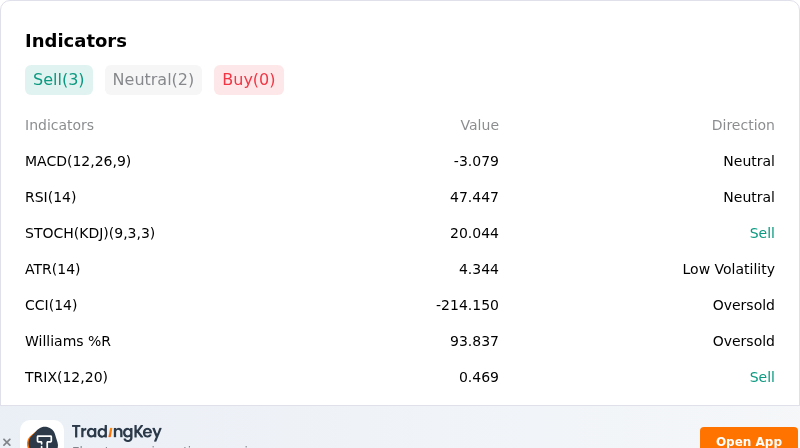
Technically, Solana (SOLUSD) shows a MACD (12,26,9) value of -3.079, indicating a neutral signal. The RSI at 47.447 suggests neutral condition and the Williams %R at 93.837 suggests oversold condition. Please monitor closely.
IndicatorAnalysis

More details about Solana (SOLUSD)

Recent Events and Risks:

  • Macro Tightening and Fed Interest Rate Pressures: Heightened market expectations of a Federal Reserve interest rate hike during the September FOMC meeting, combined with 10-year U.S. Treasury yields holding above 5%, have tightened overall financial conditions and sapped risk appetite for high-beta digital assets like Solana.
  • Regulatory Setbacks and Legislative Stalls: The U.S. Senate's failure to advance key crypto market structure legislation (the CLARITY Act) in recent cloture voting renewed broader regulatory uncertainty, triggering immediate risk-off selling across altcoin markets.
  • Derivatives Leverage Unwinds and Forced Liquidations: Overextended open interest and heavy long positioning in Solana derivatives led to rapid long liquidation cascades when price pressure mounted, accelerating intraday downside momentum.
  • Institutional Outflow Trends and Support Breakdown: Following strong inflows earlier in the quarter, spot Solana exchange-traded funds experienced intermittent net outflows, coinciding with SOL breaking below the critical $100 psychological handle to expose lower technical support zones down to $94.
Disclaimer: For information purposes only. Past performance is not indicative of future results.
placeholder
US August CPI lands tonight: after a 5.4% PPI shock, will the Fed hike on September 16?US August PPI came in at 5.4% year-on-year, above the 5.3% consensus, with core PPI at 4.6%. Traders have pushed the odds of a 25bp Fed hike on September 15-16 to around 70%. Tonight's CPI is the last major inflation print before the decision — here is the full calendar, the consensus numbers, and what a hot versus cool reading would mean for the dollar, yields, gold and stocks.
Author  Irene Q.
Sep 11, Fri
US August PPI came in at 5.4% year-on-year, above the 5.3% consensus, with core PPI at 4.6%. Traders have pushed the odds of a 25bp Fed hike on September 15-16 to around 70%. Tonight's CPI is the last major inflation print before the decision — here is the full calendar, the consensus numbers, and what a hot versus cool reading would mean for the dollar, yields, gold and stocks.
placeholder
Brent tests $108 as a key export pipeline stays shut — can the rally clear $110?Brent crude rose 2.55% to $106.97 and WTI 2.32% to $102.30 as a major regional export pipeline remained offline with no restart timeline. Front-month backwardation has widened to $5.53 from $3.84 a week ago, European gas is at its highest since December 2022, and one analyst sees $119.48 if talks stall.
Author  Irene Q.
Sep 14, Mon
Brent crude rose 2.55% to $106.97 and WTI 2.32% to $102.30 as a major regional export pipeline remained offline with no restart timeline. Front-month backwardation has widened to $5.53 from $3.84 a week ago, European gas is at its highest since December 2022, and one analyst sees $119.48 if talks stall.
placeholder
Fed hike odds near 90% into Wednesday's decision — how to trade the dollar, gold and the S&P 500A 0.3% monthly core CPI print has lifted the market-implied probability of a 25bp Fed hike on 16 September to roughly 86.5% ~ 90%, which would be the first increase since July 2023. Here is the decision timeline, the pricing versus the forecasts, both scenarios, and the key levels for the dollar, gold and the S&P 500.
Author  Suzie
Sep 14, Mon
A 0.3% monthly core CPI print has lifted the market-implied probability of a 25bp Fed hike on 16 September to roughly 86.5% ~ 90%, which would be the first increase since July 2023. Here is the decision timeline, the pricing versus the forecasts, both scenarios, and the key levels for the dollar, gold and the S&P 500.
placeholder
Gold falls below $4,300 as higher US yields bolster Fed rate hike betsGold price (XAU/USD) tumbles to near $4,295 during the early Asian session on Tuesday. The precious metal faces some selling pressure as rising bond yields and surging energy prices strengthen expectations that the US Federal Reserve (Fed) will raise interest rates this week. 
Author  FXStreet
Yesterday 01: 23
Gold price (XAU/USD) tumbles to near $4,295 during the early Asian session on Tuesday. The precious metal faces some selling pressure as rising bond yields and surging energy prices strengthen expectations that the US Federal Reserve (Fed) will raise interest rates this week. 
placeholder
【Daily Brief】10-year Treasury yield briefly tops 5%, S&P 500 slips to 7,602 and the dollar firms at 99.3 as the Fed's decision eve beginsThe 10-year Treasury yield touched 5.014% on Monday — its first print above 5% since October 2023 — while the S&P 500 closed 0.48% lower at 7,619.98 and the dollar index firmed to 99.3. Here is the full market wrap ahead of Wednesday's FOMC decision, the dot plot and the August retail sales report, plus today's CLARITY Act Senate vote.
Author  Irene Q.
19 hours ago
The 10-year Treasury yield touched 5.014% on Monday — its first print above 5% since October 2023 — while the S&P 500 closed 0.48% lower at 7,619.98 and the dollar index firmed to 99.3. Here is the full market wrap ahead of Wednesday's FOMC decision, the dot plot and the August retail sales report, plus today's CLARITY Act Senate vote.
goTop
quote