USD/CAD Price Forecast: Falls toward lower ascending channel boundary near 1.4000

Source Fxstreet
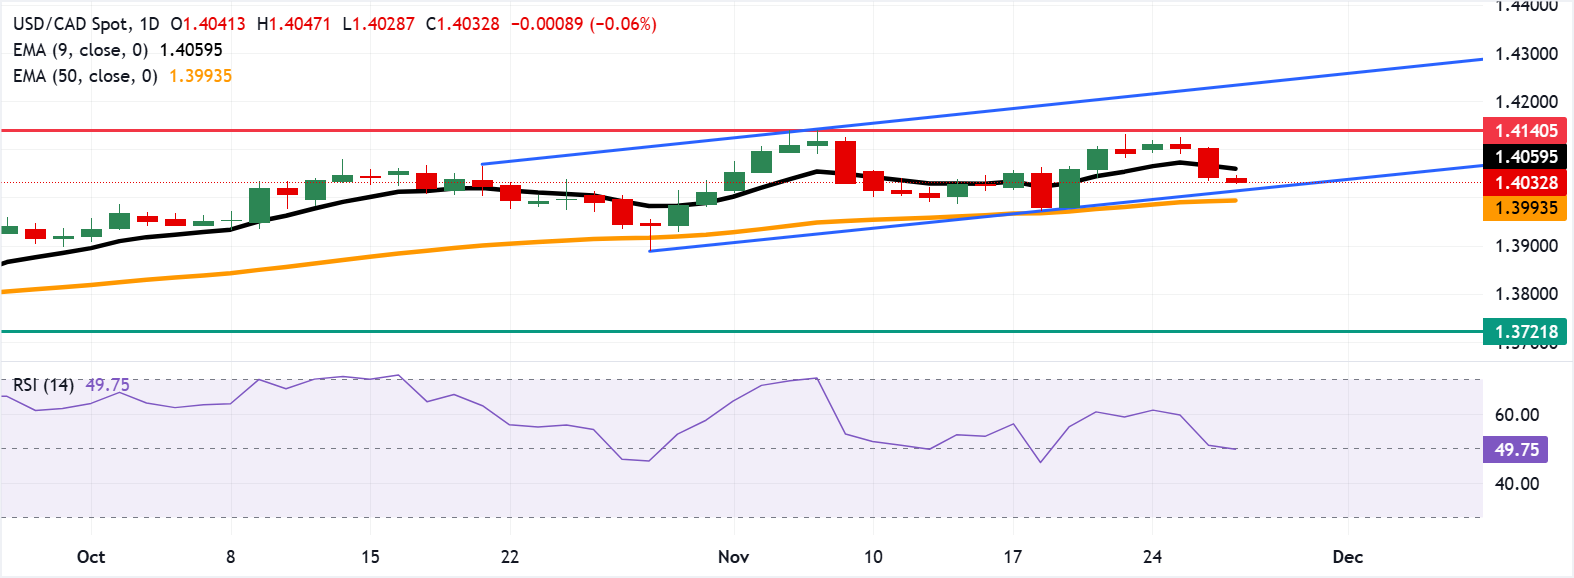
  • USD/CAD may find a primary barrier at the nine-day EMA of 1.4059.
  • The 14-day Relative Strength Index has slipped to a neutral 49.00, indicating a fading bullish impulse.
  • The primary support lies around the ascending channel’s lower boundary at 1.4020.

USD/CAD extends its losses for the third successive session, trading around 1.4030 during the Asian hours on Thursday. The daily chart’s technical setup reflects a persistent bullish bias, with the pair remaining within its ascending channel pattern.

The USD/CAD pair holds above the rising 50-day Exponential Moving Average (EMA) at 1.3990, while the nine-day EMA at 1.4059 caps the topside. This keeps the broader bias supported by the medium-term average, yet near-term momentum is constrained under the short-term gauge.

The 14-day Relative Strength Index (RSI) at 49.00 (neutral) has eased from previous readings, signaling a waning bullish impulse. RSI near its midline reinforces a balanced backdrop, so a decisive move through either moving average would be needed to set direction.

The USD/CAD pair may find the immediate resistance at the nine-day EMA of 1.4059. A break above this level would improve the short-term price momentum and lead the pair to test the seven-month high of 1.4140, reached on November 5. Further advances above this level would support the pair to explore the region around the upper boundary of the ascending channel at 1.4240.

On the downside, the initial support appears at the ascending channel’s lower boundary around 1.4020, followed by the psychological level of 1.4000 and the 50-day EMA of 1.3990. A break below this confluence support zone would weaken the bullish bias and put downward pressure on the USD/CAD pair to navigate the region around the four-month low of 1.3721.

(The technical analysis of this story was written with the help of an AI tool)

USD/CAD: Daily Chart

Canadian Dollar Price Today

The table below shows the percentage change of Canadian Dollar (CAD) against listed major currencies today. Canadian Dollar was the strongest against the US Dollar.

USD EUR GBP JPY CAD AUD NZD CHF
USD -0.09% -0.20% -0.36% -0.07% -0.27% -0.58% -0.12%
EUR 0.09% -0.11% -0.27% 0.02% -0.18% -0.49% -0.03%
GBP 0.20% 0.11% -0.17% 0.13% -0.09% -0.39% 0.08%
JPY 0.36% 0.27% 0.17% 0.27% 0.09% -0.25% 0.24%
CAD 0.07% -0.02% -0.13% -0.27% -0.18% -0.49% -0.05%
AUD 0.27% 0.18% 0.09% -0.09% 0.18% -0.31% 0.15%
NZD 0.58% 0.49% 0.39% 0.25% 0.49% 0.31% 0.46%
CHF 0.12% 0.03% -0.08% -0.24% 0.05% -0.15% -0.46%

The heat map shows percentage changes of major currencies against each other. The base currency is picked from the left column, while the quote currency is picked from the top row. For example, if you pick the Canadian Dollar from the left column and move along the horizontal line to the US Dollar, the percentage change displayed in the box will represent CAD (base)/USD (quote).

Disclaimer: For information purposes only. Past performance is not indicative of future results.
placeholder
2025 Black Friday is coming! Which stocks may see volatility?Coming on the day right after Thanksgiving in the United States, Back Friday marks the start of the holiday shopping season. Sales data from this shopping frenzy day reflects investor confidence and consumer trends. The National Retail Federation (NRF) predicts that holiday season (Nov and Dec) retail sales in 2025 will likely exceed $1 trillion for the very first time, which represents a year-over-year increase of 3.7 to 4.2 percent. Historic data from the past decade show that the retail sector has generally outperformed the S&P 500 during the weeks before and after Black Friday. The following retailing companies are expected to be big winners:
Author  Insights
Nov 24, Mon
Coming on the day right after Thanksgiving in the United States, Back Friday marks the start of the holiday shopping season. Sales data from this shopping frenzy day reflects investor confidence and consumer trends. The National Retail Federation (NRF) predicts that holiday season (Nov and Dec) retail sales in 2025 will likely exceed $1 trillion for the very first time, which represents a year-over-year increase of 3.7 to 4.2 percent. Historic data from the past decade show that the retail sector has generally outperformed the S&P 500 during the weeks before and after Black Friday. The following retailing companies are expected to be big winners:
placeholder
Bitcoin Bleeds to $86K, But This Key Indicator Screams "The Top Isn't In"Bitcoin’s adjusted Spent Output Profit Ratio (aSOPR) has spent nearly two years coiling below the extremes seen at past bull-market peaks, even as BTC trades around $86,300 and down 9% on the week — a setup that leaves open the possibility that this cycle’s true top may still lie ahead.
Author  Mitrade
Nov 25, Tue
Bitcoin’s adjusted Spent Output Profit Ratio (aSOPR) has spent nearly two years coiling below the extremes seen at past bull-market peaks, even as BTC trades around $86,300 and down 9% on the week — a setup that leaves open the possibility that this cycle’s true top may still lie ahead.
placeholder
Bitcoin Price Rebound Gains Traction with $90K Break in SightBitcoin is trading above $87,000 and its 100-hour SMA after rebounding from $83,500, with a bearish trend line at $88,200 and resistance at $89,000–$90,000 now in focus as BTC either breaks higher toward $91,750–$94,000 or slips back toward $86,700, $85,000 and lower supports.
Author  Mitrade
Yesterday 02: 58
Bitcoin is trading above $87,000 and its 100-hour SMA after rebounding from $83,500, with a bearish trend line at $88,200 and resistance at $89,000–$90,000 now in focus as BTC either breaks higher toward $91,750–$94,000 or slips back toward $86,700, $85,000 and lower supports.
placeholder
Bitcoin Targets $89K Breakout as S&P 500 Nears ATH on Fed Rate Cut HopesBitcoin price action shows signs of a potential short squeeze as it hovers near $88,000, with analysts watching liquidity dynamics that could push it toward $89,000 or retrace to $85,000.
Author  Mitrade
4 hours ago
Bitcoin price action shows signs of a potential short squeeze as it hovers near $88,000, with analysts watching liquidity dynamics that could push it toward $89,000 or retrace to $85,000.
placeholder
Ethereum Reclaims $3K Handle—Is a Breakout Imminent?Ethereum has jumped back above $3,000 and reclaimed key Fib levels, with a bullish trend line at $2,880 and strong MACD/RSI readings putting a breakout above $3,120–$3,165 — and a possible run toward $3,320–$3,350 — on the table, as long as support around $2,980–$2,920 holds.
Author  Mitrade
4 hours ago
Ethereum has jumped back above $3,000 and reclaimed key Fib levels, with a bullish trend line at $2,880 and strong MACD/RSI readings putting a breakout above $3,120–$3,165 — and a possible run toward $3,320–$3,350 — on the table, as long as support around $2,980–$2,920 holds.
goTop
quote