

USD/CHF (USDCHF) Volatility Intensified on Oct 14: Factors to Watch

Source Tradingkey

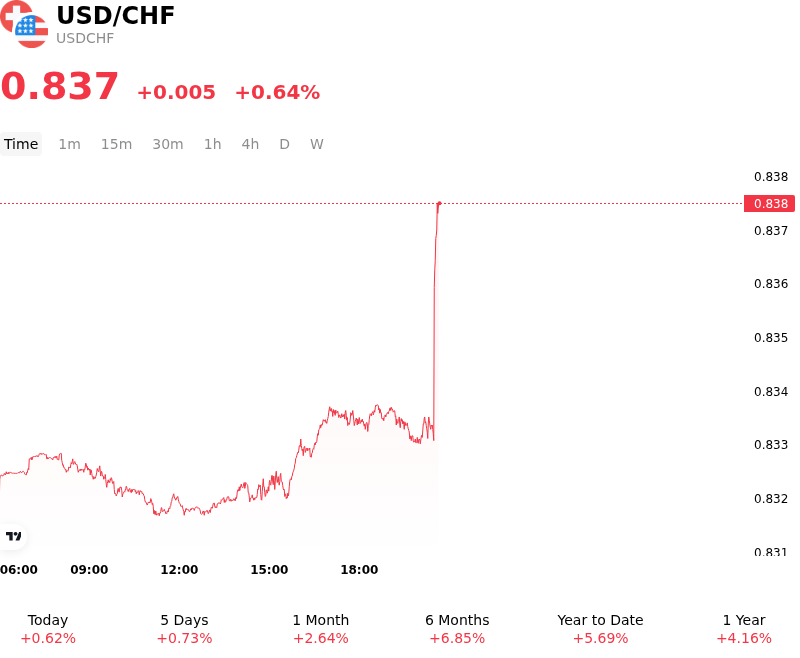
USD/CHF (USDCHF) is up 0.64% at Oct 14 08:40(ET), now at $0.83746, with a 7-day up of 0.56%.
SummaryOverview

What is driving USD/CHF (USDCHF)’s stock price up today?

The advance in USDCHF was predominantly driven by widening short-term yield differentials favoring the U.S. dollar, alongside persistent policy divergence between the Federal Reserve and the Swiss National Bank. Market expectations for Federal Reserve monetary policy leaned increasingly hawkish, anchored by resilient U.S. economic activity and upside risks to U.S. inflation. U.S. Treasury yields pushed higher as fixed-income markets repriced the path of federal funds rates, reinforcing the dollar’s yield advantage over low-yielding G10 peers. In contrast, the Swiss National Bank’s accommodative stance, supported by subdued domestic inflationary pressures and low sovereign bond yields, continued to weigh on the Swiss franc as a funding currency.

Institutional capital flows favored the U.S. dollar as market participants positioned ahead of key U.S. inflation data. Rising energy prices and potential supply-chain transmission into broader goods categories heightened concerns that core U.S. price pressures could prove sticky, prompting investors to pare back expectations for aggressive Fed rate cuts. This macro environment encouraged carry-trade strategies, with market participants selling the low-yielding Swiss franc against higher-yielding U.S. assets. The resulting unwinding of CHF long positions accelerated spot demand for USDCHF during the trading session.

From a broader macro perspective, the intraday movement reflects fundamental interest-rate differentials rather than a purely technical bounce. While safe-haven demand periodically supports the Swiss franc, current market dynamics indicate that the pronounced policy and rate differential between the Federal Reserve and the Swiss National Bank remains the dominant macro driver of price action. Investors continue to monitor U.S. inflation data, Treasury yield trajectory, and central bank commentary for confirmation of the dollar's policy-driven momentum.

Technical Analysis of USD/CHF (USDCHF)

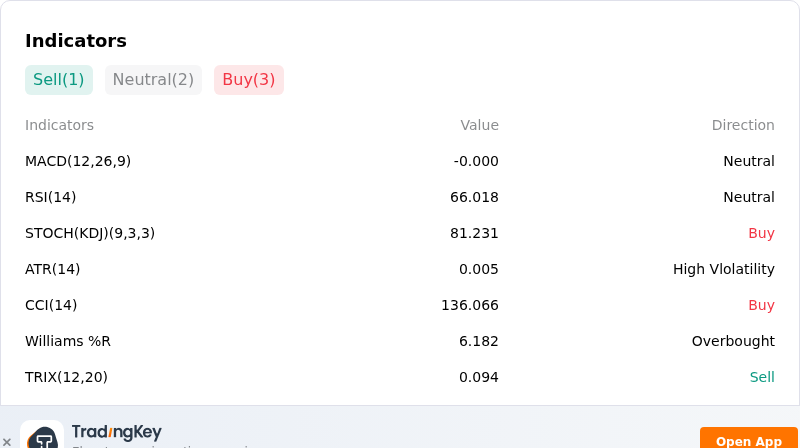
Technically, USD/CHF (USDCHF) shows a MACD (12,26,9) value of -0.000, indicating a neutral signal. The RSI at 66.018 suggests neutral condition and the Williams %R at 6.182 suggests overbought condition. Please monitor closely.
IndicatorAnalysis

More details about USD/CHF (USDCHF)

Recent Events and Risks:

  • US CPI Event Risk and Yield Retrenchment: Market positioning ahead of key US Consumer Price Index (CPI) and Producer Price Index (PPI) releases, combined with a recent pullback in US Treasury yields, risks stripping the US Dollar of its yield premium and driving USD/CHF down through key technical support near 0.8320.
  • Safe-Haven CHF Demand via European Fiscal Stress: Escalating global geopolitical instability alongside mounting concerns over European debt affordability and elevated energy expenditures have renewed safe-haven capital flows into the Swiss Franc, subjecting the USD/CHF pair to persistent downside pressure.
  • Softening US Economic Indicators: Weakness in recent US macroeconomic data—specifically a low September non-farm payroll print of 29,000 against 90,000 expected and a drop in consumer sentiment—has tempered Federal Reserve policy expectations, leaving the Greenback vulnerable to sudden sell-offs against low-beta defensive currencies.
  • Carry Trade Liquidity Stress and Reversals: Elevated volatility in global fixed-income markets and rapid yield curve movements increase the risk of CHF-funded carry trade unwinds, exposing USD/CHF to sudden liquidity shocks and stop-loss driven sell-offs if price action breaks below immediate intraday support levels.
Disclaimer: For information purposes only. Past performance is not indicative of future results.
placeholder
US September CPI preview: inflation set to hit 3.7% — will the Fed hike in December?US September CPI lands Wednesday with headline inflation seen at 3.7% y/y and core at 0.2% m/m. December hike odds sit near 70% — here are the scenarios, the calendar and the key levels.
Author  Irene Q.
Oct 10, Sat
US September CPI lands Wednesday with headline inflation seen at 3.7% y/y and core at 0.2% m/m. December hike odds sit near 70% — here are the scenarios, the calendar and the key levels.
placeholder
Yen inches toward 159 as Tokyo reopens — where is the line in the sand before 160?USD/JPY traded around 158.5 on Tuesday after Monday's 158.60 close — the highest since September 24 — as Tokyo reopened and the market re-focused on two dates dominating the yen calendar: the G20 finance ministers' meeting in Bangkok on October 15 and the Bank of Japan's October 30 decision. Here are the three forces leaning on the yen, the positioning picture, and the scenarios into Wednesday's US CPI.
Author  Irene Q.
Oct 13, Tue
USD/JPY traded around 158.5 on Tuesday after Monday's 158.60 close — the highest since September 24 — as Tokyo reopened and the market re-focused on two dates dominating the yen calendar: the G20 finance ministers' meeting in Bangkok on October 15 and the Bank of Japan's October 30 decision. Here are the three forces leaning on the yen, the positioning picture, and the scenarios into Wednesday's US CPI.
placeholder
Strong profits, falling shares: bank earnings day one meets a memory-chip rout — with CPI and ASML aheadGoldman Sachs blew past estimates (EPS $17.01 vs $13.09 expected, profit +33%) while JPMorgan missed ($5.75 vs $5.93) and Wells Fargo fell 3% — yet the S&P 500 finished flat at 7,805.45, pinned below its record close as a memory-chip rout (SOX −2.67%, Micron under $1,000) kept the pressure on. Tonight brings the week's decider: US September CPI at 8:30 ET, then Bank of America, Morgan Stanley, BlackRock and ASML before the open. Here are the levels, both cases, and the watch list.
Author  Irene Q.
20 hours ago
Goldman Sachs blew past estimates (EPS $17.01 vs $13.09 expected, profit +33%) while JPMorgan missed ($5.75 vs $5.93) and Wells Fargo fell 3% — yet the S&P 500 finished flat at 7,805.45, pinned below its record close as a memory-chip rout (SOX −2.67%, Micron under $1,000) kept the pressure on. Tonight brings the week's decider: US September CPI at 8:30 ET, then Bank of America, Morgan Stanley, BlackRock and ASML before the open. Here are the levels, both cases, and the watch list.
placeholder
Bitcoin's V-shaped rebound: from $80,953 back above $83,000 — spot buyers step in as the Fed softens, but ETF outflows lingerBitcoin slid to $80,953 on October 13 — then snapped back above $83,000, reclaiming the 81,847–82,305 'golden zone' on spot-led buying as Williams and Waller cooled the Fed's hawkish tone and the dollar pulled back from its 18-month high. But October ETF outflows near $386 million and a fear-and-greed reading of 56 say the repair is unfinished. Here are the levels, the transmission chain and both cases ahead of tonight's US CPI.
Author  Suzie
19 hours ago
Bitcoin slid to $80,953 on October 13 — then snapped back above $83,000, reclaiming the 81,847–82,305 'golden zone' on spot-led buying as Williams and Waller cooled the Fed's hawkish tone and the dollar pulled back from its 18-month high. But October ETF outflows near $386 million and a fear-and-greed reading of 56 say the repair is unfinished. Here are the levels, the transmission chain and both cases ahead of tonight's US CPI.
placeholder
Gold Price Analysis Today | Forex Gold Analysis | XAU/USD Analysis - October 14, 2026Get the latest gold price analysis, forex gold insights, and XAU/USD analysis for October 14, 2026. Read on for the details.
Author  Mitrade
19 hours ago
Get the latest gold price analysis, forex gold insights, and XAU/USD analysis for October 14, 2026. Read on for the details.
goTop
quote