


Citigroup Inc Stock (C) Moved Down by 3.46% on Oct 13: What Investors Need To Know
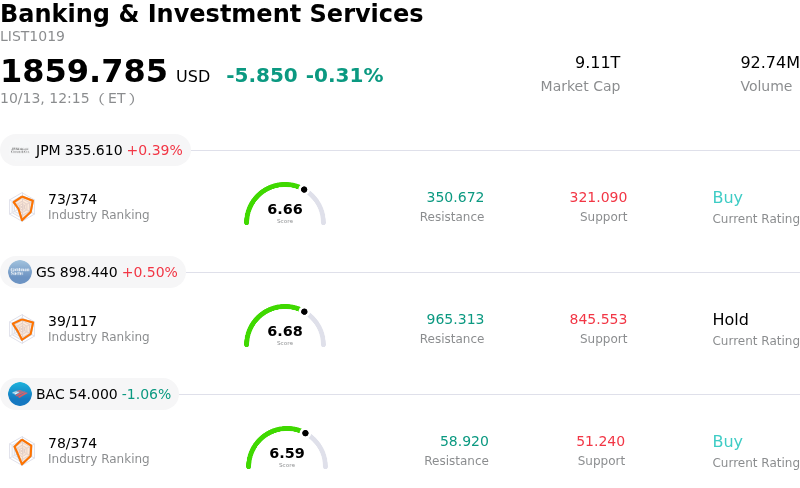
Citigroup Inc (C) moved down by 3.46%. The Banking & Investment Services sector is down by 0.31%. The company underperformed the industry. Top 3 stocks by turnover in the sector: JPMorgan Chase & Co (JPM) up 0.39%; Goldman Sachs Group Inc (GS) up 0.42%; Bank of America Corp (BAC) down 1.08%.
What is driving Citigroup Inc (C)’s stock price down today?
Citigroup experienced selling pressure and heightened intraday volatility following the release of its third-quarter financial results. Although the global banking giant delivered a solid bottom-line earnings beat driven by strong investment banking fees and robust fixed-income trading activity, headline revenue landed slightly short of higher Wall Street consensus estimates. This top-line revenue nuance created a split market interpretation, prompting immediate profit-taking among investors who had bid up the shares ahead of the reporting date.
Broader macroeconomic factors and sector-wide headwinds compounded the downward trajectory. Elevated benchmark bond yields and persistent high interest rates continue to inflate deposit funding costs across major money-center banks, narrowing net interest margin expansion prospects. Concurrently, investor focus centered on an increase in provisions for credit losses, which underscored growing caution regarding consumer credit health, sustained inflationary pressure, and potential loan loss normalization in personal banking segments.
The intraday movement also reflects a typical sell-the-news reaction following a period of strong relative outperformance. Leading into the quarterly update, market sentiment had turned increasingly constructive on Citigroup's structural turnaround, business simplification efforts, and progress toward resolving legacy regulatory consent orders. However, with quarterly capital markets activity showing cyclical softness compared to previous peaks and management offering a cautious broader economic outlook, institutional investors chose to reduce exposure. Despite short-term price volatility, Citigroup’s healthy capital ratios, structural cost discipline, and disciplined share repurchases continue to anchor its multi-year operational recovery.
Technical Analysis of Citigroup Inc (C)
Technically, Citigroup Inc (C) shows a MACD (12,26,9) value of -0.086, indicating a sell signal. The RSI at 40.929 suggests neutral condition and the Williams %R at 65.650 suggests sell condition. Please monitor closely.
Media Coverage of Citigroup Inc (C)
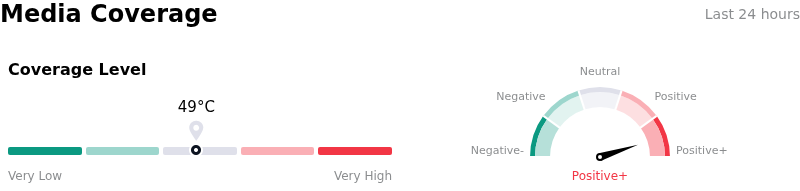
In terms of media coverage, Citigroup Inc (C) shows a coverage score of 49, indicating a moderate level of media attention. The overall market sentiment index is currently in extremely bullish zone.
Fundamental Analysis of Citigroup Inc (C)
Citigroup Inc (C) is in the Banking & Investment Services industry. Its latest annual revenue is $81.18B, ranking 4 in the industry. The net profit is $13.02B, ranking 3 in the industry. Company Profile
Over the past month, multiple analysts have rated the company as Buy, with an average price target of $152.27, a high of $170.00, and a low of $131.69.
More details about Citigroup Inc (C)
Company Specific Risks:
- Ongoing Regulatory Consent Orders and Operational Constraints: Despite recent efforts to submit remediation audit paperwork to the Federal Reserve and OCC, Citigroup continues to operate under 2020 consent orders, which impose heavy compliance spending and restrict aggressive growth in key segments like wealth management and global retail banking until risk management deficiencies are fully resolved.
- Top-Line Revenue Underperformance and Lack of Forward Guidance: Although Citigroup reported a third-quarter 2026 earnings per share beat, revenue failed to exceed consensus expectations, and the management's omission of explicit forward financial guidance leaves institutional investors uncertain about top-line growth trajectory heading into late 2026.
- High Vulnerability to Normalization in Trading Revenue: Recent quarterly profit outperformance relied heavily on strong fixed-income and trading revenues, creating downside volatility risk if capital market activity cools down and trading volume normalizes in subsequent quarters.
- Institutional Position Trimming and Premium Valuation Resistance: Recent institutional holding data indicates that major asset managers are predominantly trimming positions in Citigroup, reflecting market skepticism over valuation levels relative to the bank's financial strength and return metrics.
Recommended Articles


