

Natural Gas (NATGAS) Is up 2.44% on Oct 8: What You Need to Watch

Source Tradingkey

Natural Gas (NATGAS) is up 2.44% at Oct 8 20:00(ET), now at $3.436, with a 7-day up of 13.10%.
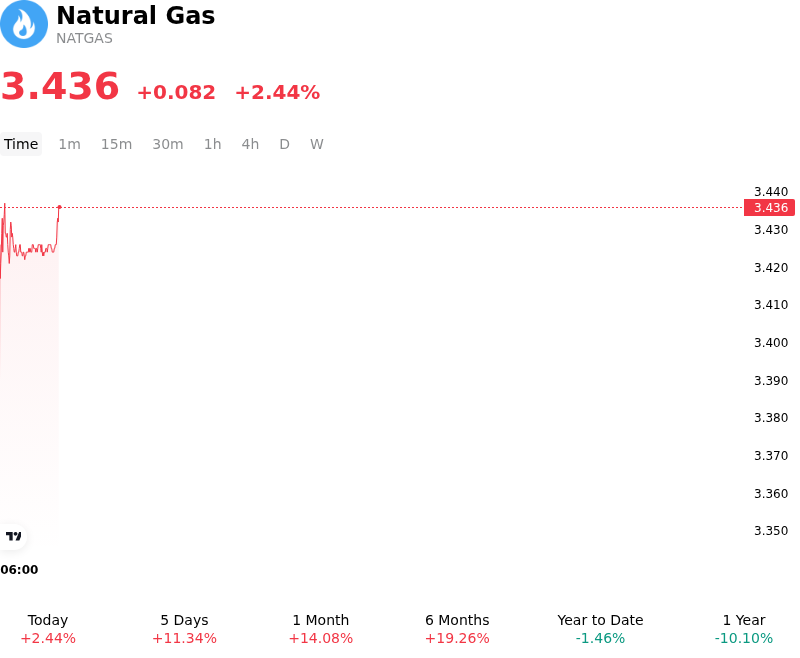
SummaryOverview

What is driving Natural Gas (NATGAS)’s stock price up today?

The advancement in natural gas futures was primarily driven by a tightening domestic supply-demand balance and expectations of a smaller-than-normal weekly storage injection. Dry gas production in the United States experienced a notable pullback as depressed regional spot prices prompted voluntary output curtailments, particularly across Appalachian producing basins, alongside seasonal pipeline maintenance disruptions. Concurrently, market expectations aligned around a below-average build in working gas inventories relative to historical norms for early October. The persistent trend of lighter weekly storage injections has progressively narrowed the storage surplus heading into the winter withdrawal season, prompting traders to recalibrate end-of-season buffer expectations.

Demand expectations received additional support from shifting medium-range weather forecasts and robust liquefied natural gas export activity. Meteorological models pointed to cooler-than-normal temperatures across northern and western regions of the United States, signaling an early uptick in residential and commercial heating demand. On the export front, feedgas flows to domestic export terminals remained elevated, bolstered by strong international demand and heightened energy security concerns across European and Asian gas markets. Resilient power sector consumption also provided baseline support, helping absorb domestic output.

From an institutional positioning perspective, the convergence of trimmed daily supply volumes, a shrinking inventory overhang, and prospective winter heating demand encouraged short-covering and speculative buying in prompt-month contracts. While broad structural production potential and comfortable aggregate inventory levels remain medium-term resistance factors, short-term balances have tightened noticeably. Market participants continue to closely monitor upcoming storage injection reports, shifts in winter heating degree day forecasts, and producer activity in response to changing hub pricing.

Technical Analysis of Natural Gas (NATGAS)

Technically, Natural Gas (NATGAS) shows a MACD (12,26,9) value of 0.044, indicating a buy signal. The RSI at 69.453 suggests neutral condition and the Williams %R at 1.253 suggests overbought condition. Please monitor closely.
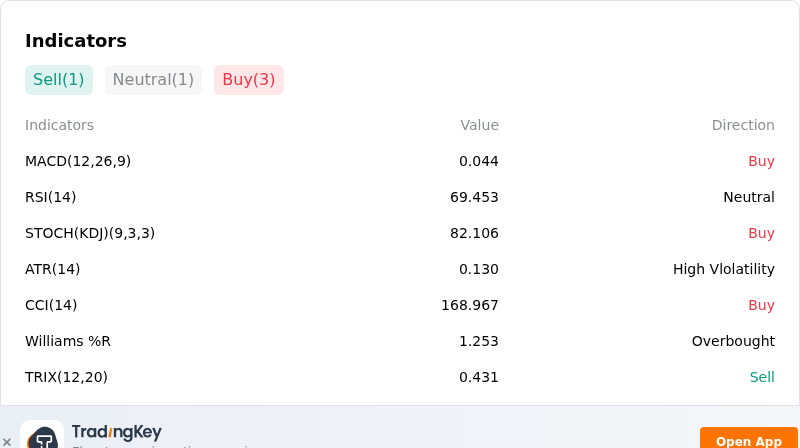
IndicatorAnalysis

More details about Natural Gas (NATGAS)

Recent Events and Risks:

  • Elevated U.S. Dry Gas Production: Lower-48 dry gas production remains persistently high near 110 to 112 billion cubic feet per day (Bcf/d), bolstered by robust associated gas output in the Permian Basin and expanding pipeline takeaway capacity, which creates continuous supply pressure on prompt-month contracts.
  • Mild Weather Outlooks and Weak Heating Demand: Near-term atmospheric models show unseasonably warm shoulder-season temperatures across major U.S. population centers, keeping space-heating demand suppressed while long-range forecasts pointing toward an El Niño pattern threaten to limit winter gas consumption.
  • Near-Record Storage Inventories: U.S. working natural gas inventories are tracking above five-year seasonal averages and are projected to approach nearly 4.0 trillion cubic feet by the end of October, providing a substantial supply cushion that caps intraday rallies and exposes prices to downside unwinds.
  • LNG Feedgas Outages and Terminal Maintenance: Intermittent maintenance shutdowns and temporary operational slowdowns at key U.S. liquefied natural gas export facilities restrict feedgas intake, diverting unconsumed volumes back into domestic spot markets and causing immediate price pullbacks.
Disclaimer: For information purposes only. Past performance is not indicative of future results.
placeholder
Gold ends three-week slide at the $4,400 line — eight straight days of ETF inflows vs a 5% 10-year and a 100 dollarSpot gold closed Friday at $4,378.39, up 0.84% on the day and about 0.8% for the week — its first weekly gain in four weeks — with the intraday high of $4,399.67 leaving it 33 cents shy of the $4,400 line. Gold ETFs have now logged eight straight sessions of inflows, but with the 10-year back above 5% and the dollar index near 100, here is what decides whether this is a reversal or a bounce.
Author  Suzie
Sep 20, Sun
Spot gold closed Friday at $4,378.39, up 0.84% on the day and about 0.8% for the week — its first weekly gain in four weeks — with the intraday high of $4,399.67 leaving it 33 cents shy of the $4,400 line. Gold ETFs have now logged eight straight sessions of inflows, but with the 10-year back above 5% and the dollar index near 100, here is what decides whether this is a reversal or a bounce.
placeholder
October hike odds climb toward 60% as Goldman and BofA both flip — what Warsh's "dose of accommodation" really changedRate futures now price roughly 55% to 62% for a 25bp hike at the October 27-28 FOMC, up from about 30% before Chair Warsh's post-meeting framing that the Fed is merely "removing some accommodation." Goldman Sachs has added an October hike to its forecast and Bank of America now sees moves in both October and December. Here is the repricing, the language behind it, and the two data points that decide it.
Author  Irene Q.
Sep 23, Wed
Rate futures now price roughly 55% to 62% for a 25bp hike at the October 27-28 FOMC, up from about 30% before Chair Warsh's post-meeting framing that the Fed is merely "removing some accommodation." Goldman Sachs has added an October hike to its forecast and Bank of America now sees moves in both October and December. Here is the repricing, the language behind it, and the two data points that decide it.
placeholder
Gold holds steady below $4,150 amid elevated US yields Gold price (XAU/USD) trades on a flat note near $4,140 during the early Asian session on Tuesday. Pressure from a stronger US Dollar (USD) and elevated US Treasury yields was offset by reduced expectations of a Federal Reserve (Fed) rate hike this month.
Author  FXStreet
Oct 06, Tue
Gold price (XAU/USD) trades on a flat note near $4,140 during the early Asian session on Tuesday. Pressure from a stronger US Dollar (USD) and elevated US Treasury yields was offset by reduced expectations of a Federal Reserve (Fed) rate hike this month.
placeholder
WTI rises to near $89.50 as Middle East supply threats offset Persian Gulf recoveryWest Texas Intermediate (WTI) oil price extends its gains for the second successive day, trading around $89.50 per barrel during the Asian hours on Wednesday. Crude oil climbed as persistent risks to Middle East energy flows overshadowed signs of rising supply from the region.
Author  FXStreet
Yesterday 01: 26
West Texas Intermediate (WTI) oil price extends its gains for the second successive day, trading around $89.50 per barrel during the Asian hours on Wednesday. Crude oil climbed as persistent risks to Middle East energy flows overshadowed signs of rising supply from the region.
placeholder
Gold Price Forecast: XAU/USD retraces gains and nears two-month lows at $4,104Gold (XAU/USD) retraces Tuesday’s gains on Wednesday and resumes its broader bearish trend, with the US Dollar (USD) appreciating across the board, as investors brace for the release of the minutes of the latest Federal Reserve (Fed) meeting.
Author  FXStreet
17 hours ago
Gold (XAU/USD) retraces Tuesday’s gains on Wednesday and resumes its broader bearish trend, with the US Dollar (USD) appreciating across the board, as investors brace for the release of the minutes of the latest Federal Reserve (Fed) meeting.
goTop
quote