


EUR/USD (EURUSD) Is down 0.58% on Oct 7: Why It Happened
EUR/USD (EURUSD) is down 0.58% at Oct 7 03:55(ET), now at $1.11919, with a 7-day down of 1.21%.
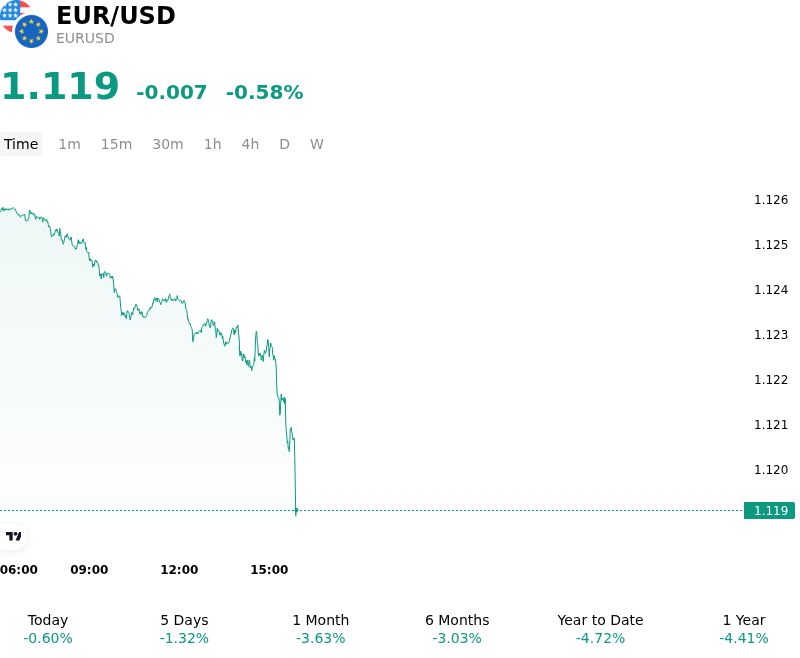
What is driving EUR/USD (EURUSD)’s stock price down today?
Rising fiscal anxiety and political fragmentation across core Eurozone economies generated substantial selling pressure on the euro relative to the greenback. French sovereign debt concerns intensified as market participants weighed budget execution risks and political gridlock surrounding deficit reduction targets. Compounded by electoral uncertainty elsewhere in Southern Europe, international investors demanded an elevated risk premium on European financial assets. This widening fiscal risk spread undercut confidence in the single currency, leading to institutional capital outflows from euro-denominated fixed income assets.
Energy market dynamics further eroded the euro's fundamental standing relative to the dollar. Renewed upward momentum in crude oil prices, driven by elevated geopolitical tension surrounding major shipping corridors, reinforced a negative terms-of-trade shock for the net energy-importing Eurozone block. Higher input costs threatened to constrain regional profit margins and consumer demand while reviving unwanted inflationary pressures. Conversely, the United States maintained a stronger macro profile, benefiting from lower energy vulnerability and resilient economic activity, which reinforced the fundamental growth differential favoring dollar-denominated assets.
On the monetary policy front, interest rate expectations continued to shift in favor of the US dollar. Hawkish rhetoric from Federal Reserve officials highlighted persistent inflation risks and reaffirmed a higher-for-longer policy trajectory, supporting Treasury yields ahead of key central bank minutes. In contrast, European Central Bank policy expectations remained constrained by fragile economic growth prospects across the bloc, preventing European bond yields from offering an attractive yield cushion against US rates. The resulting widening of real interest rate differentials reinforced broad-based US dollar demand.
From a macro perspective, the downward push on the currency pair reflects a broader structural alignment of fiscal vulnerability, terms-of-trade pressure, and relative yield differentials rather than a purely transient technical dip. While oversold technical conditions may induce short-term consolidation, the path of least resistance for the exchange rate remains anchored by divergent policy trajectories and fiscal headwinds. Market participants will continue to monitor regional budget proposals, energy price volatility, and upcoming monetary policy communications to gauge the durability of current valuation levels.
Technical Analysis of EUR/USD (EURUSD)
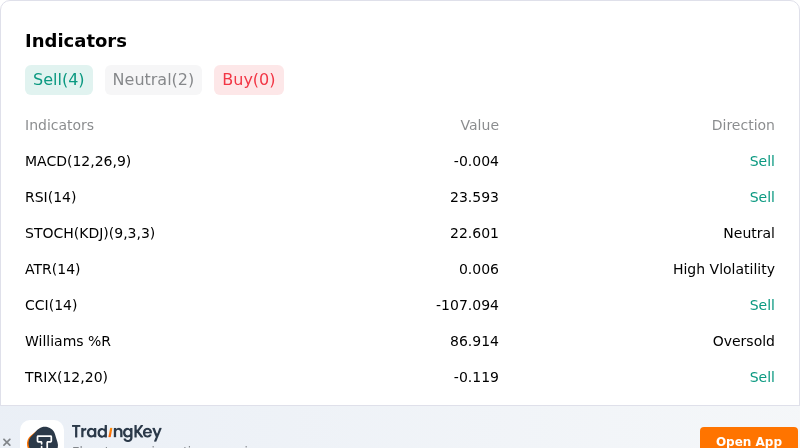
Technically, EUR/USD (EURUSD) shows a MACD (12,26,9) value of -0.004, indicating a sell signal. The RSI at 23.593 suggests sell condition and the Williams %R at 86.914 suggests oversold condition. Please monitor closely.
More details about EUR/USD (EURUSD)
Recent Events and Risks:
- French Fiscal Instability and Sovereign Yield Pressure: Escalating political friction surrounding France's draft budget has widened French-German yield spreads, introducing a fiscal risk premium that weighs directly on euro sentiment.
- Widening US-Eurozone Interest Rate Differentials: Stronger US economic growth indicators and elevated Treasury yields have pushed two-year swap rate differentials further in favor of the US dollar, reducing the carry attractiveness of the euro.
- Energy Supply Shocks and Stagflation Threats: Higher oil and energy import costs continue to pressure Eurozone trade balances and corporate margins, amplifying stagflation risks across the bloc while limiting the ECB's monetary flexibility.
- Southern European Political Risk Contagion: Emerging political instability and fiscal fragility in peripheral Eurozone economies are compounding regional risk premiums and driving defensive flows into USD-denominated safe havens.
Recommended Articles


