

Ethereum (ETHUSD) Volatility Intensified on Sep 17: What You Should Know

Source Tradingkey

Ethereum (ETHUSD) is up 1.15% at Sep 17 21:30(ET), now at $2436.28, with a 7-day down of 0.94%.
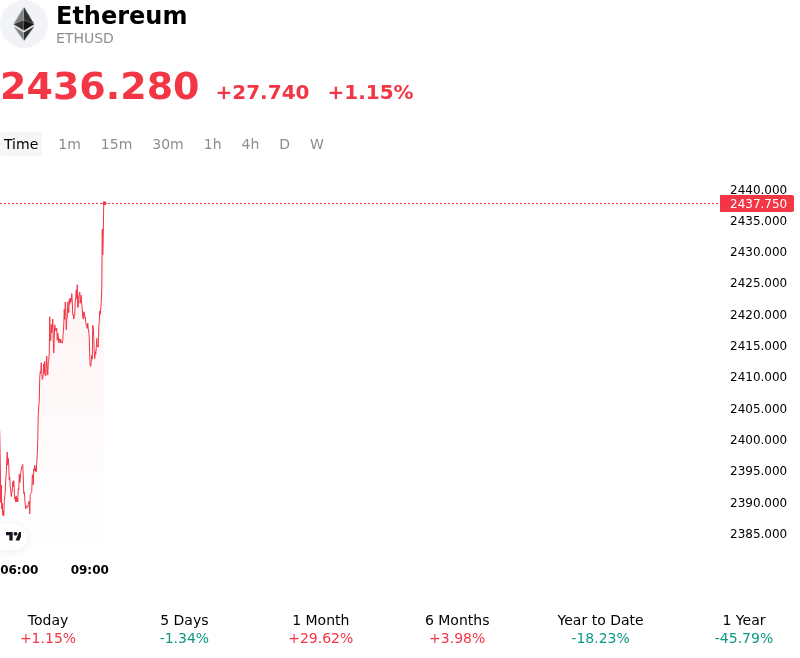
SummaryOverview

What is driving Ethereum (ETHUSD)’s stock price up today?

Following the resolution of the Federal Reserve’s monetary policy announcement, Ethereum experienced a relief bounce as macro uncertainty receded. While central bank communications maintained a data-dependent stance, market participants treated the event as a tactical opportunity to rebuild exposure. The preceding wash-out of overleveraged positions in the derivatives market effectively cleared excess speculative open interest, creating a cleaner structural backdrop for spot demand to re-emerge. As forced liquidations subsided and order-book depth stabilized near key technical support zones, short-covering and dip-buying capital triggered a steady intraday price appreciation.

Underlying on-chain dynamics played a central role in sustaining the price recovery. Continued net withdrawals from centralized exchanges significantly reduced readily available market float, creating a supply-side buffer against broader macro tightening. On-chain data indicated structural accumulation by institutional entities and non-exchange addresses, alongside ongoing staking lockups, which served to compress circulating liquid supply. Although spot Ethereum ETF flows showed mixed activity across primary market issuers during surrounding sessions, long-term treasury allocations and corporate balance sheet purchases provided consistent price floors.

Looking ahead, the movement represents a tactical event-driven rebound following a period of macro-induced de-risking and derivative unwinding. While elevated Treasury yields and unresolved regulatory frameworks continue to pose headwinds for high-beta digital assets, Ethereum's structural network supply contraction and resilient layer-two transaction volume maintain a constructive baseline for medium-term institutional adoption. Investors remain focused on central bank forward guidance and spot ETF capital trends as key indicators for sustained trend continuation.

Technical Analysis of Ethereum (ETHUSD)

Technically, Ethereum (ETHUSD) shows a MACD (12,26,9) value of -52.136, indicating a neutral signal. The RSI at 52.894 suggests neutral condition and the Williams %R at 75.365 suggests sell condition. Please monitor closely.
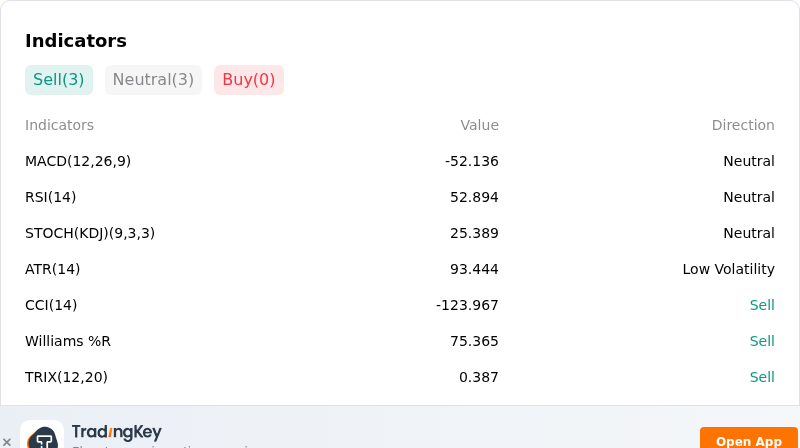
IndicatorAnalysis

More details about Ethereum (ETHUSD)

Recent Events and Risks:

  • U.S. Legislative Regulatory Setback: The failure of the U.S. Senate to advance the CLARITY Act in a 49–50 vote removed expected regulatory market structure clarity, sparking immediate risk-off selling that pushed Ethereum below key support at $2,400.
  • Surge in Spot ETF Capital Outflows: U.S. spot Ethereum ETFs experienced a sharp reversal in institutional demand, recording $142.3 million in net daily outflows on September 15—led by $98 million in withdrawals from BlackRock's ETHA—marking one of the deepest daily institutional capital exits in months.
  • Derivatives Liquidation Cascade: The regulatory pull-back triggered a forced de-leveraging event across derivatives markets, wiping out over $570 million in long positions and creating a liquidity vacuum in ETH perpetual futures that leaves market structure vulnerable to further intraday spikes in volatility.
  • Macroeconomic Policy Pressure and Technical Downside: Hawkish Federal Reserve interest rate guidance and broader tightening in global monetary conditions are dampening demand for risk assets, threatening a further breakdown toward secondary support near the $2,266 EMA if spot buying fails to absorb ongoing retail distribution.
Disclaimer: For information purposes only. Past performance is not indicative of future results.
placeholder
Fed hike odds near 90% into Wednesday's decision — how to trade the dollar, gold and the S&P 500A 0.3% monthly core CPI print has lifted the market-implied probability of a 25bp Fed hike on 16 September to roughly 86.5% ~ 90%, which would be the first increase since July 2023. Here is the decision timeline, the pricing versus the forecasts, both scenarios, and the key levels for the dollar, gold and the S&P 500.
Author  Suzie
Sep 14, Mon
A 0.3% monthly core CPI print has lifted the market-implied probability of a 25bp Fed hike on 16 September to roughly 86.5% ~ 90%, which would be the first increase since July 2023. Here is the decision timeline, the pricing versus the forecasts, both scenarios, and the key levels for the dollar, gold and the S&P 500.
placeholder
Gold falls below $4,300 as higher US yields bolster Fed rate hike betsGold price (XAU/USD) tumbles to near $4,295 during the early Asian session on Tuesday. The precious metal faces some selling pressure as rising bond yields and surging energy prices strengthen expectations that the US Federal Reserve (Fed) will raise interest rates this week. 
Author  FXStreet
Sep 15, Tue
Gold price (XAU/USD) tumbles to near $4,295 during the early Asian session on Tuesday. The precious metal faces some selling pressure as rising bond yields and surging energy prices strengthen expectations that the US Federal Reserve (Fed) will raise interest rates this week. 
placeholder
【Daily Brief】10-year Treasury yield briefly tops 5%, S&P 500 slips to 7,602 and the dollar firms at 99.3 as the Fed's decision eve beginsThe 10-year Treasury yield touched 5.014% on Monday — its first print above 5% since October 2023 — while the S&P 500 closed 0.48% lower at 7,619.98 and the dollar index firmed to 99.3. Here is the full market wrap ahead of Wednesday's FOMC decision, the dot plot and the August retail sales report, plus today's CLARITY Act Senate vote.
Author  Irene Q.
Sep 15, Tue
The 10-year Treasury yield touched 5.014% on Monday — its first print above 5% since October 2023 — while the S&P 500 closed 0.48% lower at 7,619.98 and the dollar index firmed to 99.3. Here is the full market wrap ahead of Wednesday's FOMC decision, the dot plot and the August retail sales report, plus today's CLARITY Act Senate vote.
placeholder
Silver breaks $64 as precious metals rebound — can gold hold the $4,280 line into the Fed decision?Silver has climbed back above $64 an ounce for the first time this week, leading a broad rebound across precious metals hours before the Federal Reserve delivers what is expected to be its first rate hike since 2023. Spot silver was last at $64.64, up 1.49% on the day, while gold reclaimed $4,300 and platinum and palladium both advanced. The question now is whether the bounce is a genuine turn — or a pause before the Fed's dot plot decides the next move.
Author  Suzie
18 hours ago
Silver has climbed back above $64 an ounce for the first time this week, leading a broad rebound across precious metals hours before the Federal Reserve delivers what is expected to be its first rate hike since 2023. Spot silver was last at $64.64, up 1.49% on the day, while gold reclaimed $4,300 and platinum and palladium both advanced. The question now is whether the bounce is a genuine turn — or a pause before the Fed's dot plot decides the next move.
placeholder
Bitcoin falls below $75,000 as the CLARITY Act fails in the Senate — what the vote means for cryptoThe US Senate blocked the Digital Asset Market CLARITY Act in a 49-50 procedural vote, sending Bitcoin briefly below $75,000 — its biggest one-day drop since June. Ethereum fell more than 8%, Coinbase slid 10% and $75 billion of crypto market value evaporated. Here is what the vote was, why it failed, and the levels that matter now.
Author  Suzie
18 hours ago
The US Senate blocked the Digital Asset Market CLARITY Act in a 49-50 procedural vote, sending Bitcoin briefly below $75,000 — its biggest one-day drop since June. Ethereum fell more than 8%, Coinbase slid 10% and $75 billion of crypto market value evaporated. Here is what the vote was, why it failed, and the levels that matter now.
goTop
quote